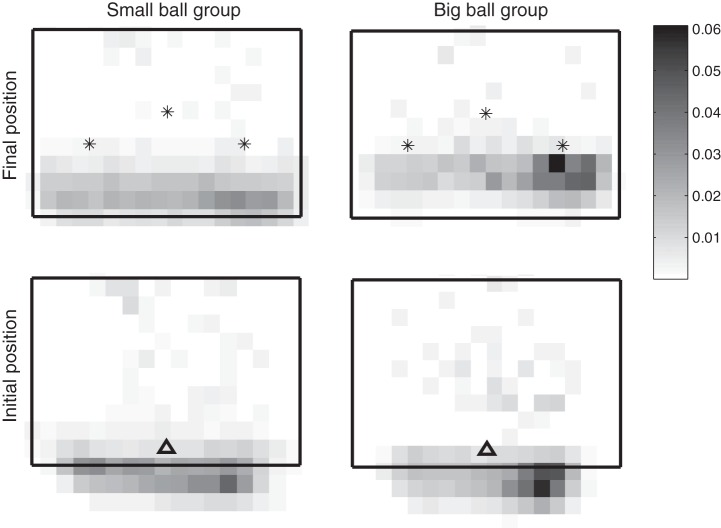
Fig. 11.
Three-dimensional histograms of Pong initial or final positions of all hit tries of all subjects. Color intensity represents the averaged probability of counts in 1 pixel. The rectangle represents the Pong borders. Top: distribution of final positions of the Pong reaching movements together with the targets in the blind reaching condition (asterisks). Bottom: distribution of initial movement positions together with the starting point in the blind reaching condition (triangles).

