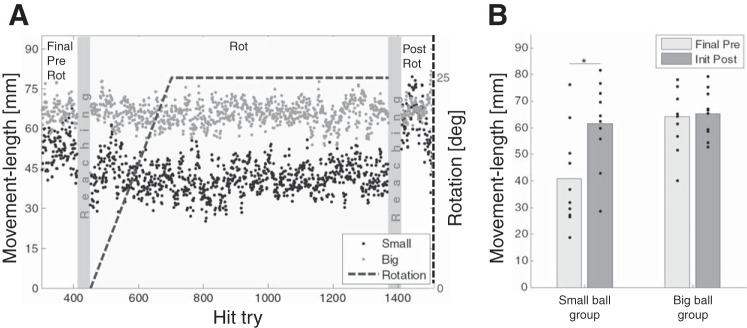
Fig. 9.
Average movement lengths along the experiment, demonstrating a postrotation rise in the online feedback corrections at the small-ball group. A: the movement length during the 3 experimental sessions, averaged across subjects for the 2 groups. The dots represent the averaged data of every hit try of each group (depicted by color). At the rotation session, the size of the rotation is indicated by the dashed line and the right y-axis. Between the Pong sessions, gray rectangles represent trials in which the reaching task was carried out. Data were filtered with a moving average filter with window length of 5 hit tries. B: average of 5 successive movement lengths from the final prerotation and the initial postrotation results. Individual means are presented by the dots, and bar values represent the mean of all subjects. Significance is depicted by asterisks (P < 0.05).

