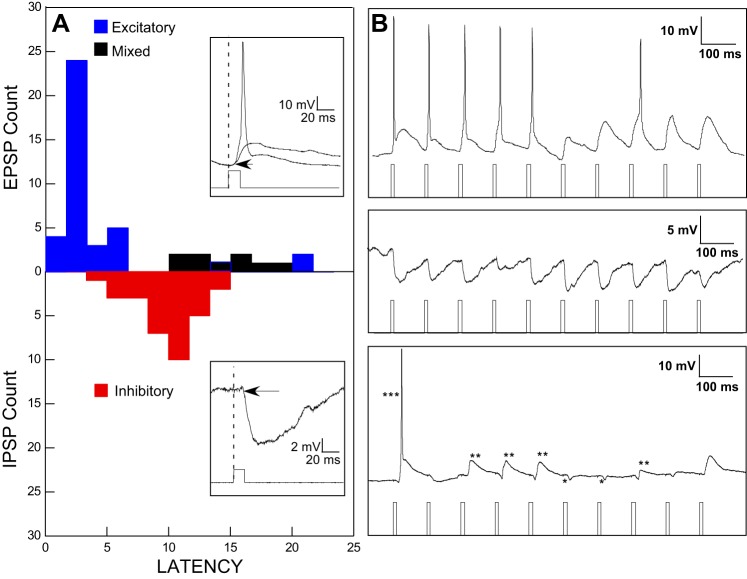
Fig. 2.
A: histograms of optically evoked response latencies for neurons with purely excitatory responses (blue), inhibitory responses (red), and mixed excitatory and inhibitory responses (black). Insets: examples of responses at expanded time bases illustrating short-latency action potentials or excitatory graded potentials (top) and an optically evoked inhibitory potential (bottom). B: examples of responses to trains of optical stimulation illustrating each of the 3 categories in the histogram: purely excitatory (top), purely inhibitory (middle), and mixed (bottom). For the mixed responses, *** indicates an action potential (truncated), ** indicates graded excitatory responses usually preceded by an inhibitory response, and * indicates a purely inhibitory response. Excitatory responses could indicate either postinhibitory rebound or effects of disinhibition.

