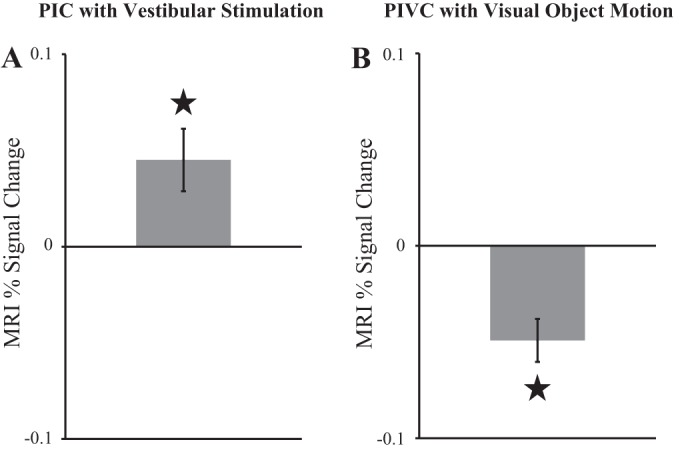
Fig. 5.

Results of univariate fMRI analyses of the vestibular and visual localizers. To avoid circularity, activations in areas PIC and PIVC were only analyzed in the localizer scan that was not used for region of interest definition. Activations were computed separately for stimulation and baseline conditions (in units MRI percent-signal change from implicit baseline). For displaying purposes activation during baseline was subtracted from activation during stimulation. Therefore, positive values reflect more activation during stimulation vs. baseline and negative values reflect stronger activation in baseline vs. stimulation. Shown are mean values with standard error of the mean (SE). ⋆Significant effects. A: vestibular activation in PIC during caloric stimulation vs. baseline. B: deactivation of PIVC in visual object motion vs. static baseline.
