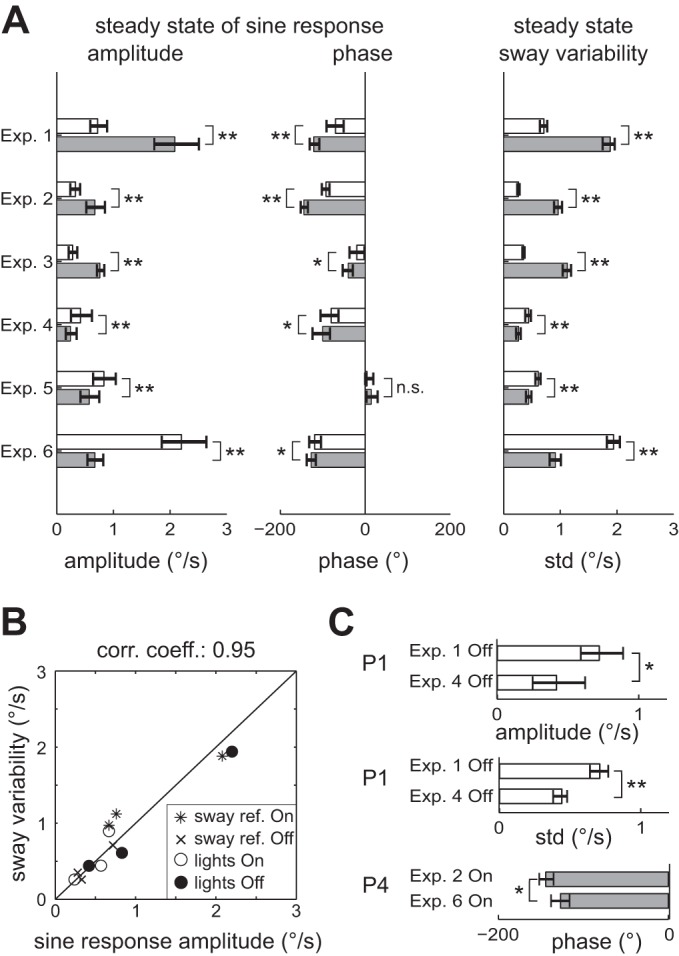
Fig. 3.

Steady-state values of sine response amplitude, sine response phase, and sway variability. A: Off (open bars) and On (gray bars) steady-state values, defined as the average values during the 10.8 s prior to a transition; error bars indicate 95% bootstrap confidence limits. Results of bootstrap significance tests for differences between On and Off values are represented by * (P < 0.05) or ** (P < 0.01). B: comparison of sway variability and sine response amplitude for each steady state. Diagonal line indicates identity of both parameters. C: selected parameters, with 95% confidence limits, for the comparison of pairs with identical steady-state conditions that were realized twice in different experimental tests. The only difference within each pair is that for one steady-state condition the upcoming transition is switching sway referencing On (P1) or Off (P4), while the other is switching lights On (P1) or Off (P4). Only parameters of pairs with significant differences are shown. Other combinations of identical steady-state conditions are indicated in Tables 1 and 2.
