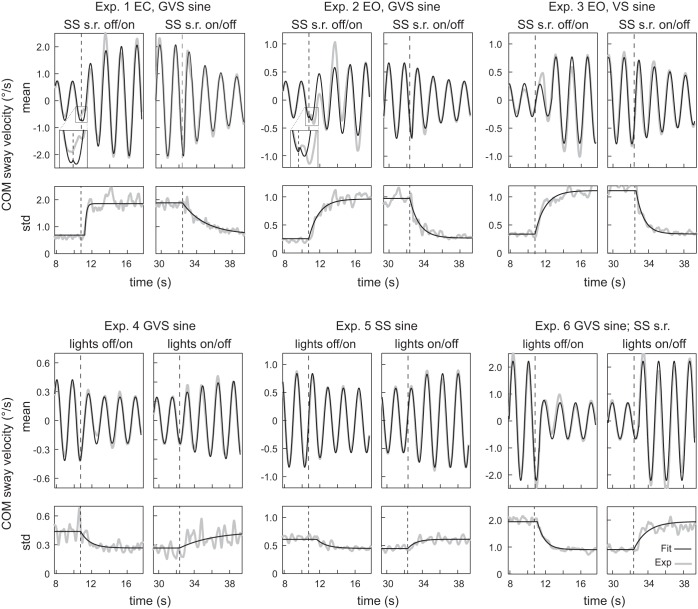
Fig. 4.
Time course of the identified exponential fit functions (black line) that best described the experimental COM sway velocity data (gray line). Shown are the Off-to-On and On-to-Off transitions of the sine responses (mean, top) and of the sway variability (std, bottom) for all experimental tests. Note that the scale of the y-axis changes across tests.

