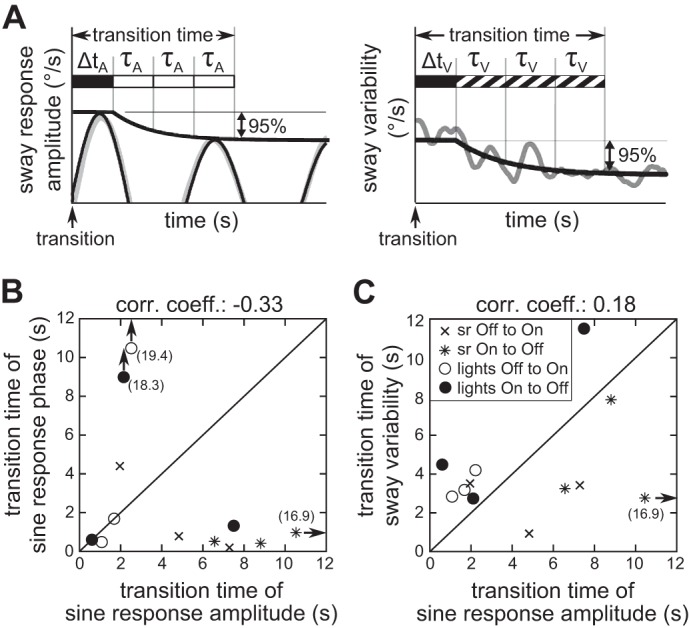
Fig. 5.

Transition times of all experimental tests. A: definition of transition times for the sine response amplitude (left) and sway variability (right). B and C: summary of transition times with sine response phase plotted over sine response amplitude (B) and sway variability plotted over sine response amplitude (C). Very large transition times are indicated with arrows and the corresponding values in parentheses.
