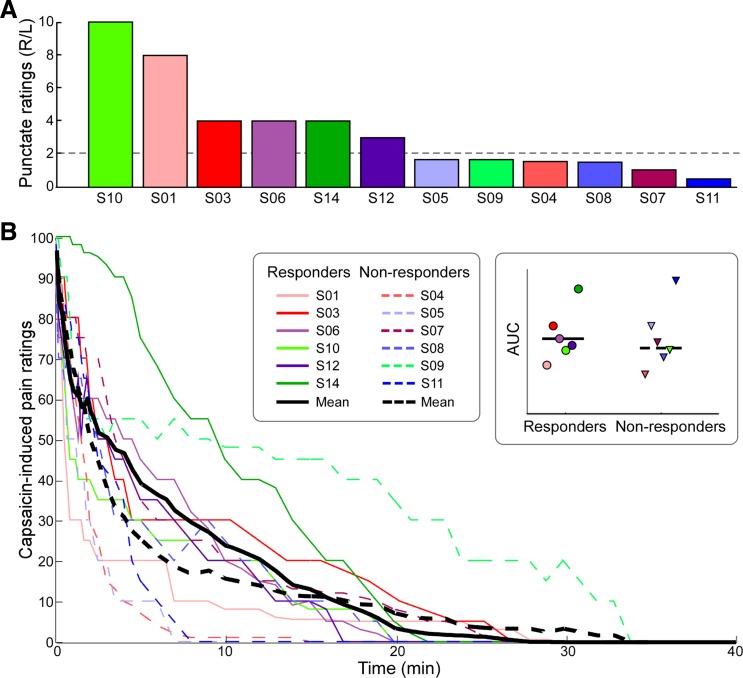
Fig. 2.
A: participants were divided into 2 groups according to the ratio of ratings to punctate stimulation of the right (R) and left (L) hands: participants who rated the intensity of right hand stimulation as at least twice that of the left hand stimulation were classified as responders. Participants were sorted by the ratio of reported intensity ratings (R/L), in descending order. B: time course of capsaicin-induced pain ratings. Single participants are color coded. Solid lines indicate responders. All participants rated the pain intensity between 90 and 100 at the moment of the injection. Pain ratings decreased fairly quickly over time. Inset: comparison of the mean area under the curve (AUC) between responders and nonresponders revealed no significant difference (t10 = 0.39, P = 0.70). Colored symbols indicate single-subject AUC data.

