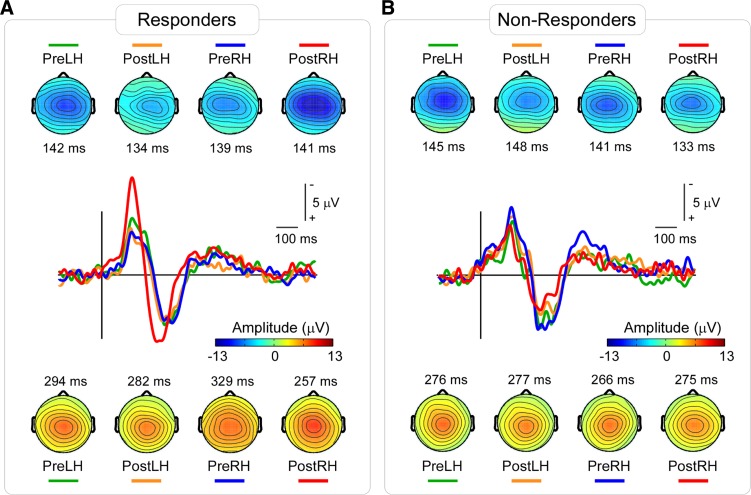
Fig. 4.
Group-average ERP waveforms and scalp maps elicited by IES in responders (A) and nonresponders (B). Waveforms at the channel Cz in different conditions are shown in different colors. The ERP elicited by IES stimuli clearly increased after capsaicin injection only on the right hand in responders. Scalp maps at the N2 peak latencies show a central distribution, slightly lateralized to the hemisphere contralateral to the stimulated hand, maximal at the vertex (top). Scalp maps at the P2 peak latencies show a central distribution, maximal at the vertex (bottom). Color bar shows the ERP amplitude in scalp maps.

