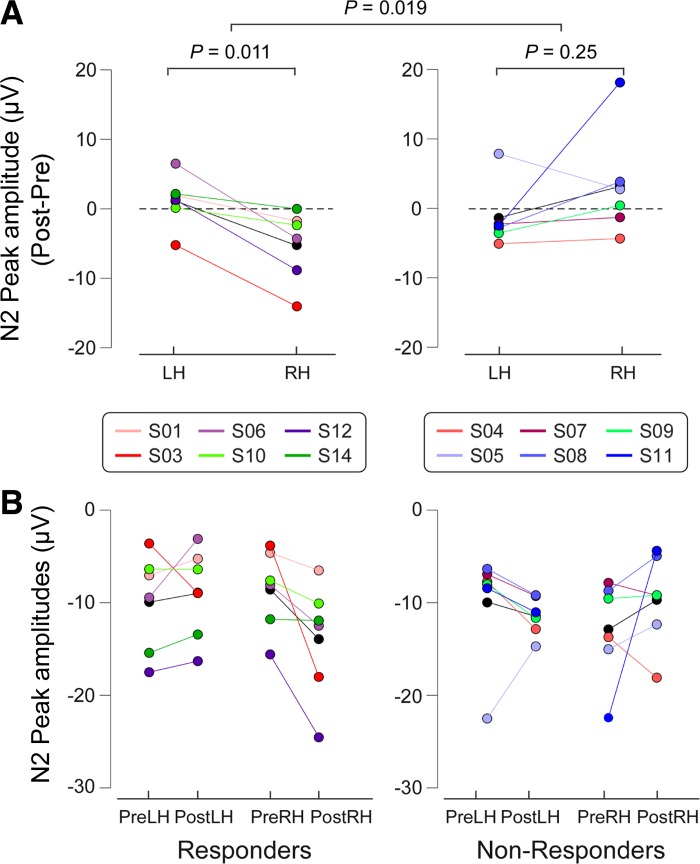
Fig. 5.
ERP amplitudes (N2) of IES of responders (left) and nonresponders (right). A: to highlight the interaction between Session and Hand in each group, the subtracted ERP amplitudes (post- minus pre-capsaicin injection) are shown for each hand. Colored circles indicate single subjects, and black circles indicate the group average for each condition. Two-way ANOVA revealed that responders had a significant interaction between the factors Session and Hand. This reveals a capsaicin-induced increase of IES ERP amplitudes (Post-Pre) on the right hand. In contrast, in nonresponders the 2-way ANOVA did not show any significant effect. These differences in the capsaicin effect on ERP amplitudes between responders and nonresponders were confirmed by the 3-way ANOVA, which revealed a significant triple interaction (Group × Session × Hand; comparison between left and right panels). B: individual values (colored circles) and mean value (black circles) for each condition.

