
Fig. 5.
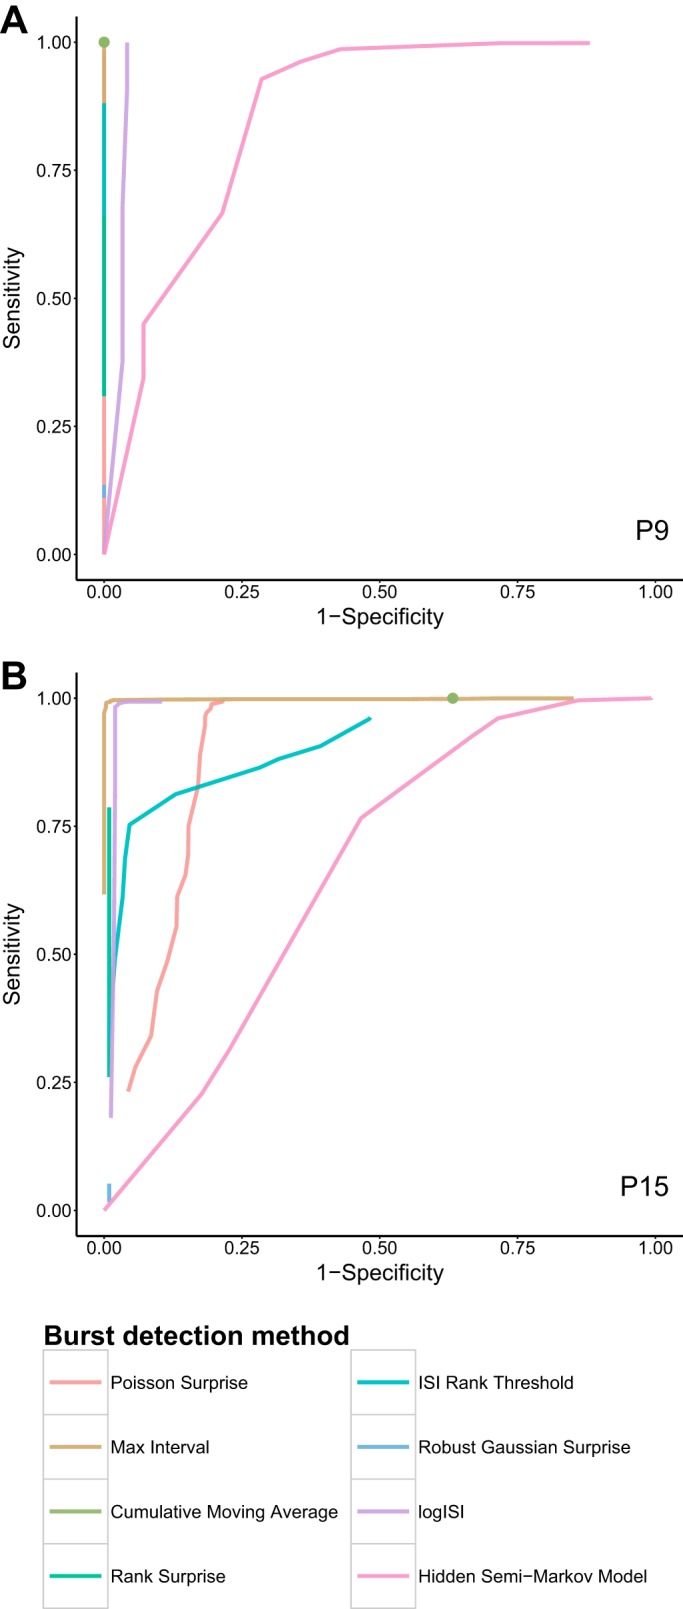
ROC curves showing the fraction of true positive (sensitivity) and false positive (1 − specificity) spikes identified as being within bursts for a variety of input parameter values, for recordings of mouse retinal ganglion cells at P9 (A) and P15 (B). The ground truth bursts for hour-long recordings from 5 randomly selected electrodes at each age were determined by visual inspection (examples in Fig. 2), and the mean performance of each burst detector over the 5 electrodes is shown. Some curves do not span the entire range because of innate restrictions on the maximum proportion of spikes that can be allocated to bursts by each method. Green dot represents the single specificity and sensitivity value found by the CMA method, which has no obvious parameter to vary.