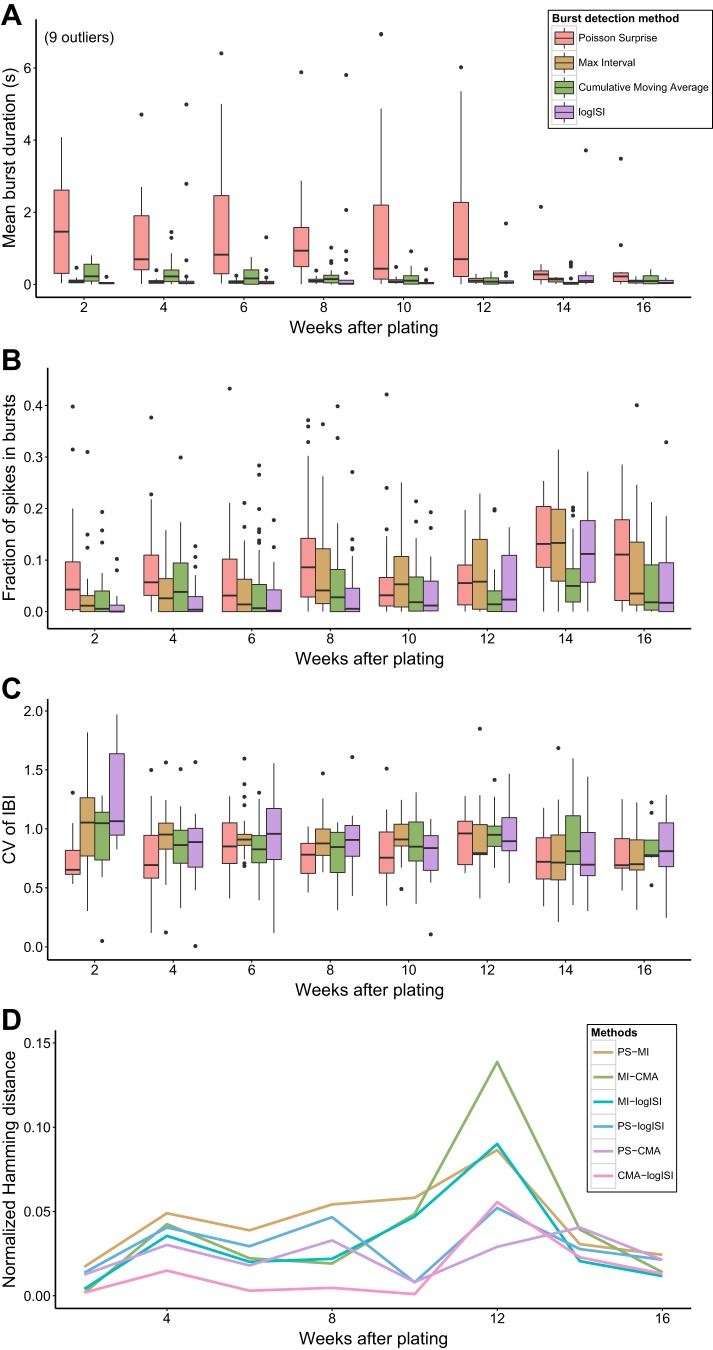
Fig. 7.
Analysis of recordings of networks of human induced pluripotent stem cell-derived neurons. A: mean burst duration. B: fraction of spikes in bursts. C: coefficient of variation of interburst intervals (CV of IBI). Each data point in the box plots is the mean value across all electrodes from 1 recording. D: median normalized Hamming distance between each pairwise combination of burst detection methods at each week after plating.

