
Figure 1.
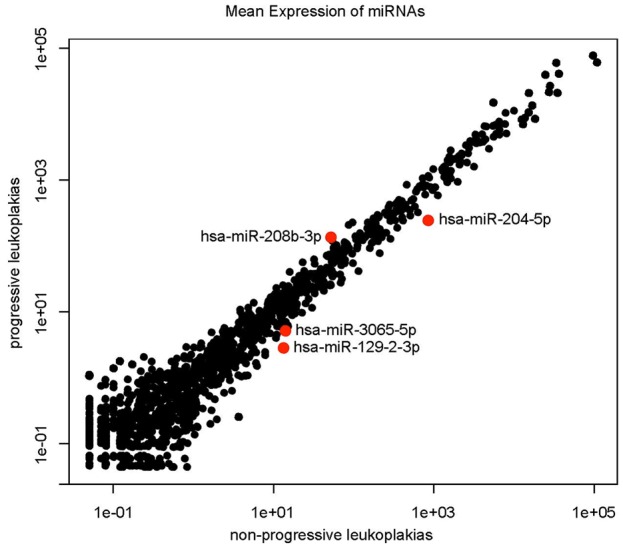
Scatterplot demonstrating overexpression of miRNA-208-3p and underexpression of miRNAs-204-5p, 3065-5p and 129-2-3p in the Progressive Group (Group 1) compared to the Non-Progressive Group (Group 2) in the training set (n=20) as measured by deep sequencing.