
Figure 5.
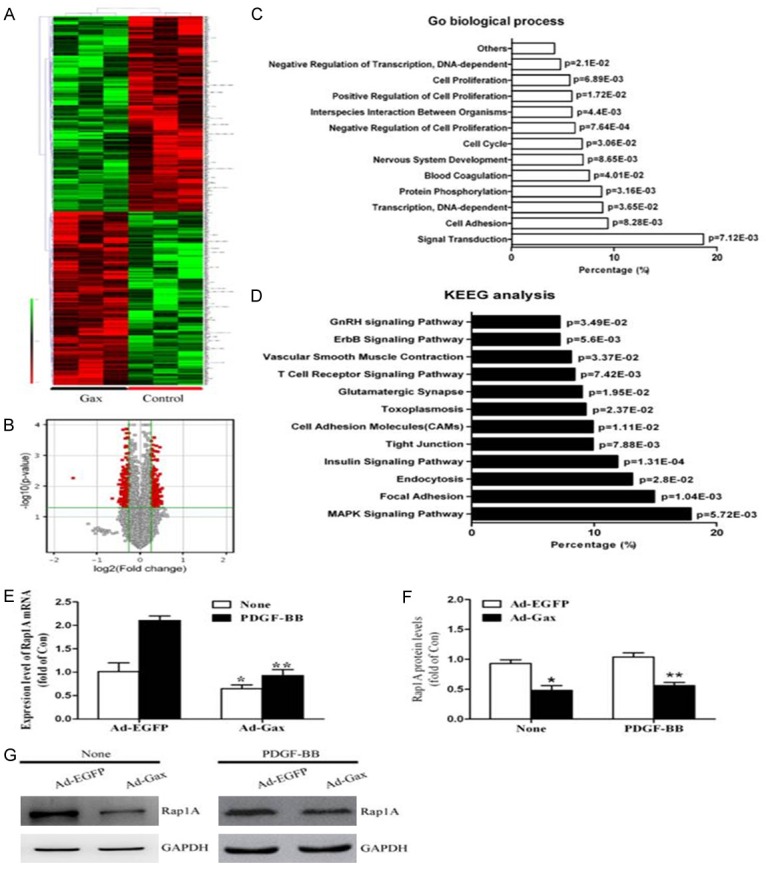
Identification of Rap1A as downstream target gene of transcription factor Gax in HASMCs. A. The unsupervised hierarchical clustering of differentially expressed genes in HASMCs transfected with Ad-Gax compared with Control samples was shown. For each gene, red represented high expression, and green indicated low expression relative to the average of all samples. B. Volcano plot showed human gene expression array data obtained from Ad-Gax -transfected HASMCs. Gax overexpression (3 experiments) altered 476 genes. The X-axis of these plots indicated the fold change in gene expression in a log2 format. Any point<0 suggested down-regulated genes. The Y-axis was the -log10 of the P value and all points in red were significant (P<0.05). The most down-regulated gene was Rap1A. C. Shown was relative distribution of the biological process highly enriched among Gax down-regulated targeted genes by GO analysis. D. Shown was KEGG analysis of potential signaling pathways highly enriched among targeted genes down-regulated by transcription factor Gax. E. Effect of Gax on Rap1A mRNA expression in None- or PDGF-induced HASMCs. *P<0.05 versus Ad-EGFP without PDGF-BB treatment. **P<0.05 versus Ad-EGFP with PDGF-BB stimuli. F. Densitometric analysis of Rap1A protein levels as examined by Western blot. G. *P<0.05 versus Ad-EGFP without PDGF-BB treatment. **P<0.05 versus Ad-EGFP with PDGF-BB stimuli.