
Figure 6.
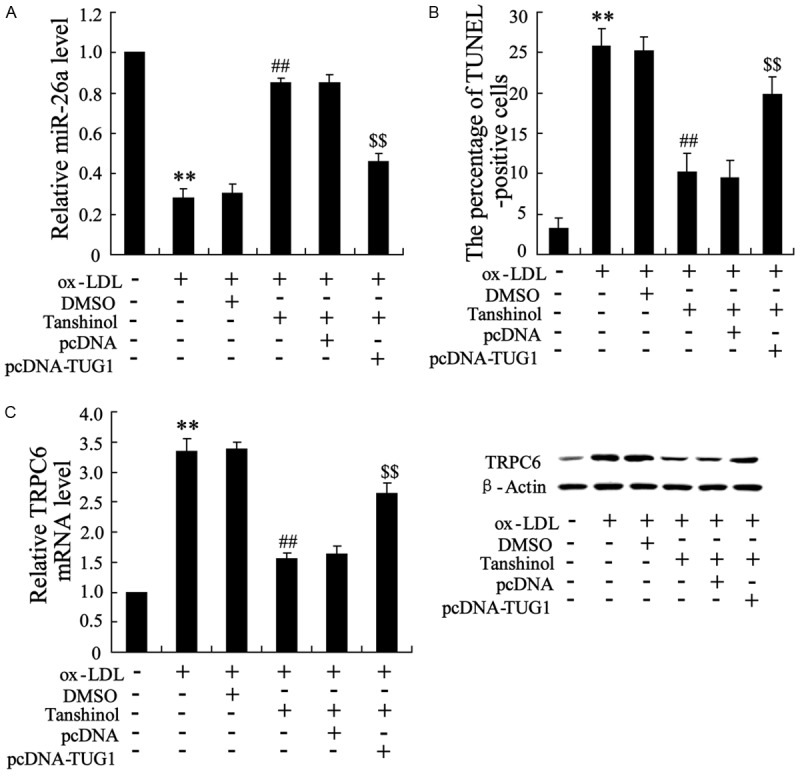
Overexpression of TUG1 removed the reversed effect of tanshinol on ox-LDL for endothelial cells. Endothelial cells were divided into six groups: control (group 1), treat with ox-LDL (25 μg/ml) (group 2), treat with ox-LDL and DMSO (group 3), treat with ox-LDL and tanshinol (1.0 mg/L) (group 4), treat with ox-LDL and tanshinol and pcDNA (group 5), treat with ox-LDL and tanshinol and pcDNA-TUG1 (group 6). A. The mRNA level of miR-26a were detected. B. The mRNA and protein level of TUG1 were detected. C. The averaged data of a poptotic (TUNEL-positive) cell ratio in endothelial cells. The data are presented as the mean ± SD. **VS control, P<0.01; ##VS ox-LDL, P<0.01; $$VS ox-LDL + pcDNA, P<0.01.