
Figure 4.
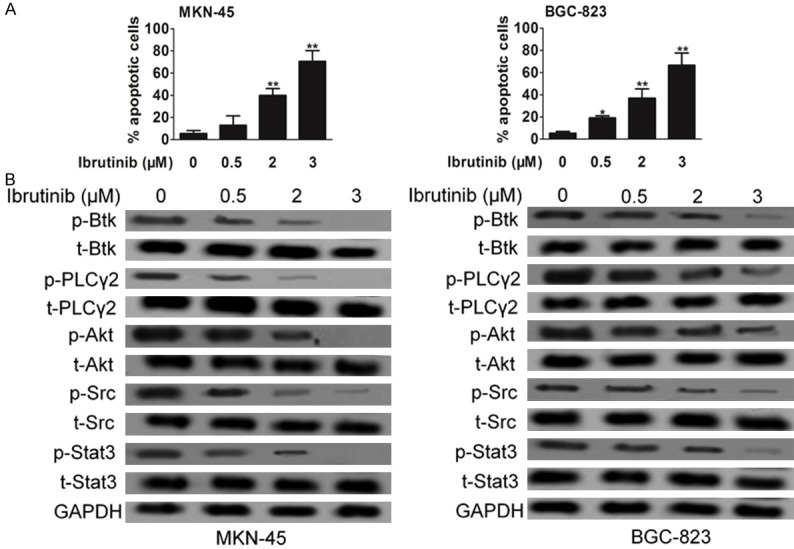
Impact of ibrutinib on Btk signaling pathway. A. Induction of apoptosis of cells following treatment with ibrutinib. Apoptosis was analyzed using PI staining as well as Annexin V-FITC apoptosis detection kit. B. Representative western blots of the expression and phosphorylation of Btk in cells treated with ibrutinib. The normalized Btk and p-Btk bands intensities were expressed as fold change in comparison to control. Data are the mean ± SD from 3 independent experiments. Statistical differences obtained at *P < 0.05, **P < 0.01.