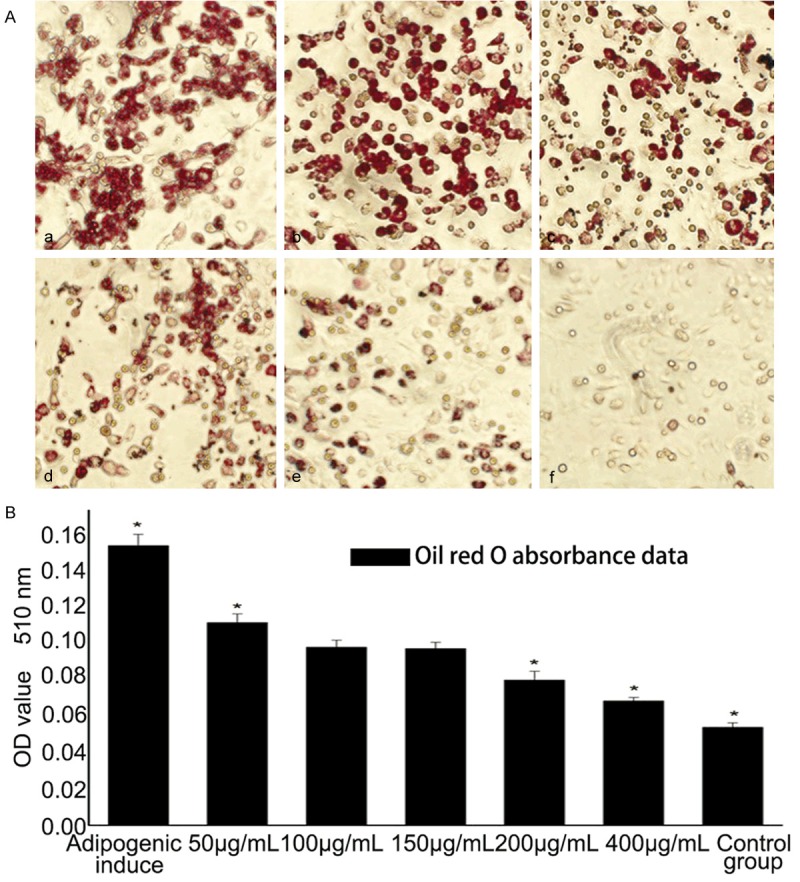
Figure 5.

Effects of EGB on adipogenic differentiation of BMSCs. (A) Oil Red O staining for intracellular lipid droplets when cultured with different concentration of EGB in adipogenic medium. From (a-e), the concentrations of EGB were 50 μ0reEGB e μ0reEGB e μ0reE, 200eE, B e 400 μ00eE, respectively; (f) is a control group. The accumulation of intracellular lipid droplets decreased with the increase of EGB concentration. (B) Oil Red O absorbance was measured at 510 nm. EGB had significantly decreased the OD values compared to controls in a dose-dependent manner (*P<0.05) (n=7).
