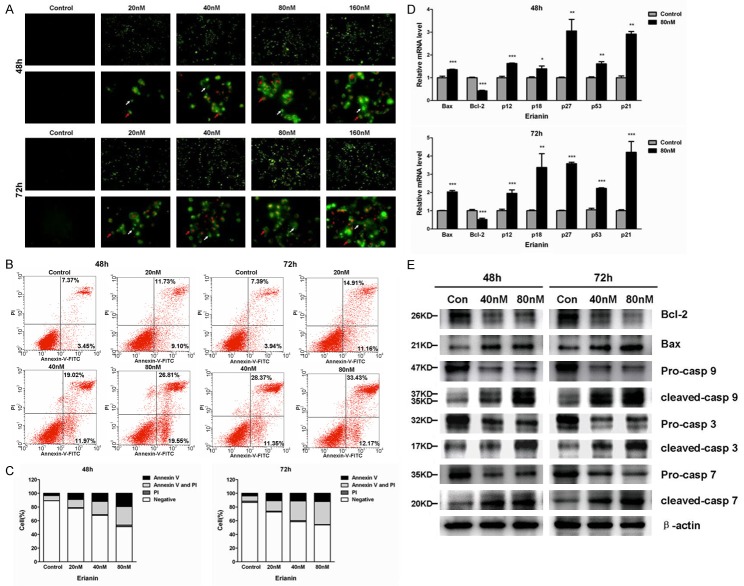
Figure 4.
Erianin induced T47D cells apoptosis. A. Visualization of apoptotic cells by Annexin V/PI staining assay on T47D cells. White arrows indicate early apoptotic cells and red arrows indicate late apoptotic cells. B. The apoptotic status was determined by flow cytometry analysis. C. Percentages of negative (viable) cells, annexin V-positive (early apoptotic) cells, PI-positive (necrotic) cells, or annexin V and PI double-positive (late apoptotic) cells were shown. Data represent the mean ± SD (n=3), *P<0.05, **P<0.01, ***P<0.001 compared to control cells. D. qPCR analysis for Bax, Bcl-2, p12, p18, p27, p53 and p21 in erianin-treated cells. Data represent the mean ± SD (n=3), *P<0.05, **P<0.01, ***P<0.001 compared to control cells. E. Effects of erianin on protein levels of Bcl-2, Bax and caspases in T47D cells.

