Figure 1.

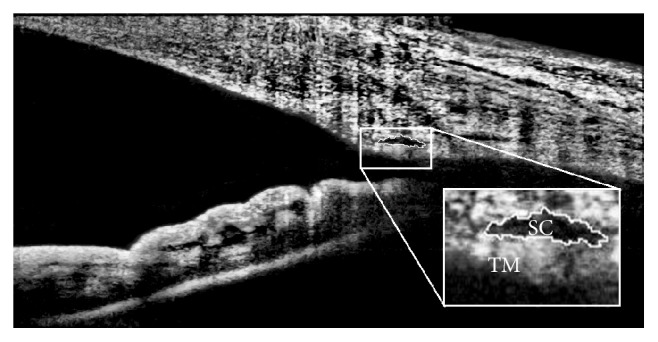
Visualization of outflow structures (SC, TM) with AS-OCT. The image was adjusted to maximize visualization with ImageJ program.

Visualization of outflow structures (SC, TM) with AS-OCT. The image was adjusted to maximize visualization with ImageJ program.