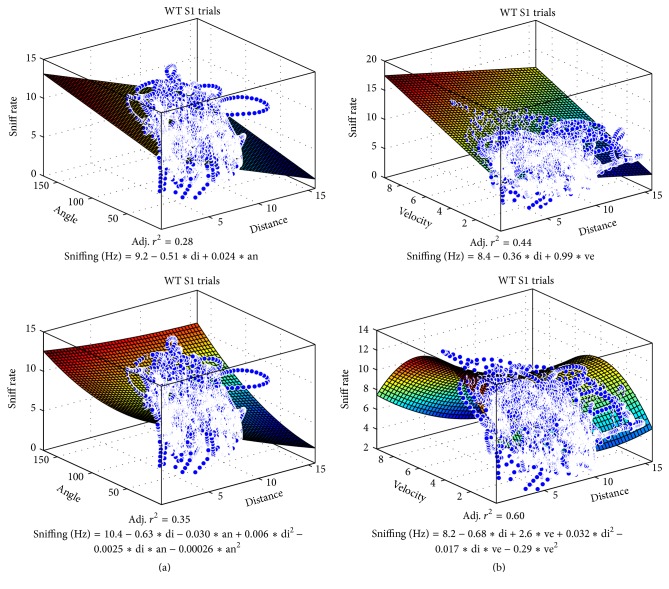
Figure 9.
Distance and velocity combined predict sniff rates. Plots of the population vector sniff rates in state-space ((a) distance and angle; (b) velocity and distance) used in Figure 8 and the multiple regression equations and adjusted r 2 for all WT S1 trials combined (8407 time bins).

