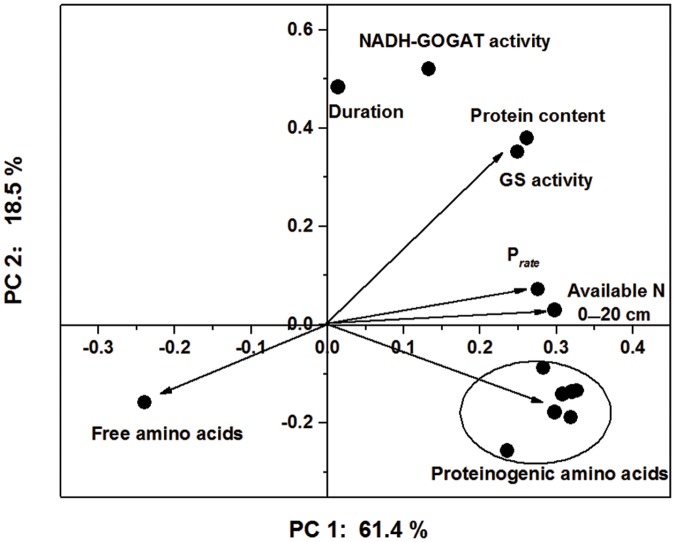
FIGURE 5.
Principal component analysis of the soil-available N content, N assimilation, rate of protein accumulation and proteinogenic amino acid profile based on the first two principal components (PC 1: principal component 1; and PC 2: principal component 2). The arrows represent the principal component loadings, and the ellipses represent the proteinogenic amino acid profiles.

