
Figure 4. C9orf72 regulates translocation of the ULK1 complex.
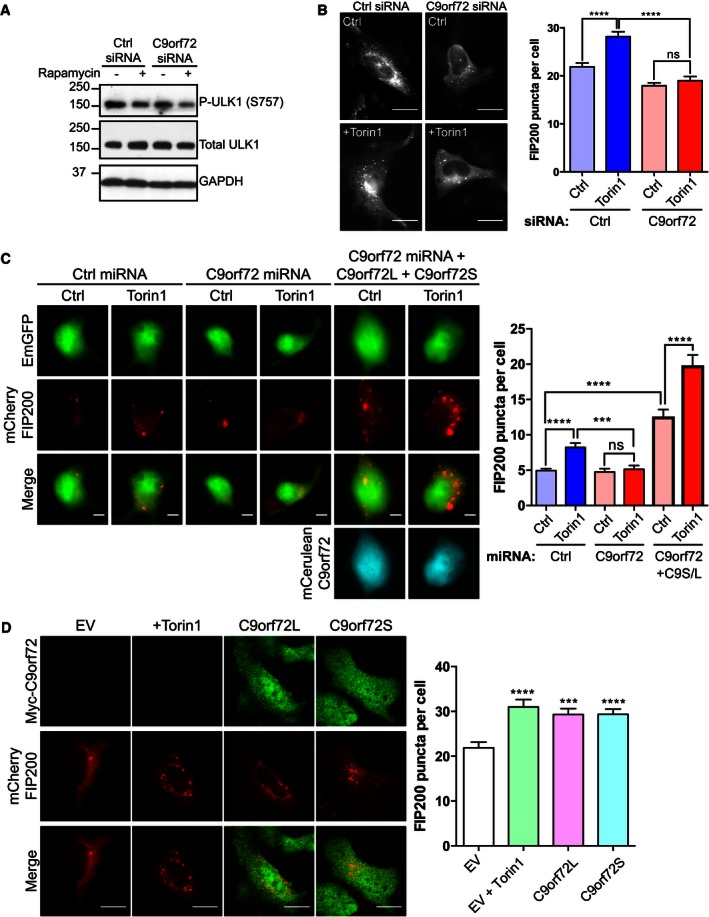
- HEK293 cells were transfected with non‐targeting (Ctrl) or C9orf72 siRNA. Cells were treated with rapamycin for 6 h to induce autophagy. Activation of ULK1 was determined on immunoblots using phospho‐ULK1 (Ser757), total ULK1, and GAPDH Abs (loading control).
- HeLa cells treated with non‐targeting (Ctrl) or C9orf72 siRNA were transfected with mCherry‐FIP200. Twenty‐four hours post‐transfection, cells were treated for 3 h with Torin1 (250 nM) or vehicle (Ctrl). Translocation of the ULK1 complex was quantified as the number of mCherry‐FIP200‐positive puncta per cell from 3 independent experiments (mean ± SEM; one‐way ANOVA with Fisher's LSD test, ns: not significant, ****P ≤ 0.0001; N (cells) = Ctrl/Ctrl: 65; Ctrl/Torin1: 60; C9orf72/Ctrl: 54; C9orf72/Torin1: 49). C9orf72 knockdown was determined by RT–qPCR (Appendix Fig S2). Scale bar = 10 μm.
- Primary cortical neurons (DIV5/6) were transfected with EmGFP non‐targeting (Ctrl) or C9orf72 miRNA (green) and mCherry‐FIP200 (red); for rescue experiments, the cells were additionally transfected with mCerulean‐tagged C9orf72s and C9orf72L (cyan). Three days post‐transfection, neurons were treated for 3 h with Torin1 (250 nM) or vehicle (Ctrl). Translocation of the ULK1 complex was quantified as the number of mCherry‐FIP200‐positive puncta per soma from 2 independent experiments (mean ± SEM; one‐way ANOVA with Fisher's LSD test, ns: not significant, ***P ≤ 0.001, ****P ≤ 0.0001; N (cells) = Ctrl miRNA/Ctrl: 134; Ctrl miRNA/Torin1: 125; C9orf72 miRNA/Ctrl: 101; C9orf72 miRNA/Torin1: 78; C9orf72 miRNA+C9orf72L+C9orf72S: 41; C9orf72 miRNA+C9orf72L+C9orf72S/Torin1: 39). Scale bar = 5 μm.
- HeLa cells were co‐transfected with mCherry‐FIP200 (red) and empty vector (EV), FLAG‐C9orf72L, or FLAG‐C9orf72S (green). As positive control, EV‐transfected cells were treated for 3 h with Torin1 (250 nM). Translocation of the ULK1 complex was quantified as the number of mCherry‐FIP200‐positive puncta per cell from 3 independent experiments (mean ± SEM; one‐way ANOVA with Fisher's LSD test, ***P ≤ 0.001, ****P ≤ 0.0001; N (cells) = EV: 47, EV+Torin1: 31, C9orf72L: 46, C9orf72S: 45). Scale bar = 10 μm.
Source data are available online for this figure.