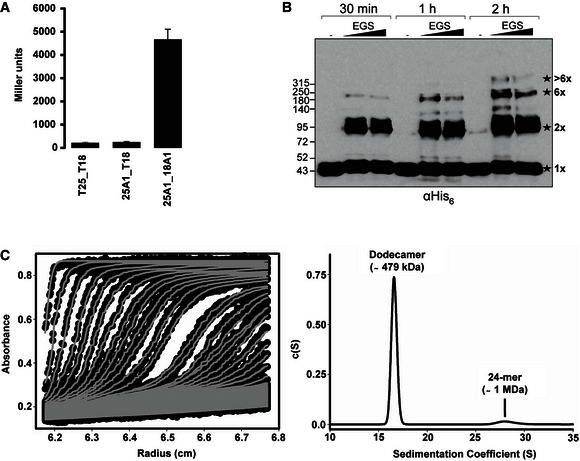
Figure 2. TssA1 forms a homo‐multimeric complex.

- BTH experiments showing that TssA1 is able to self‐interact in vivo. A graphical representation of β‐galactosidase activity from co‐transformants of E. coli DHM1 cells producing TssA1 (A1) fused to the adenylate cyclase T25 or T18 subunits is shown. The values shown on the y‐axis correspond to the activity in Miller units. In each case, average activity from two independent samples is shown and error bars indicate the standard deviation (SD). Experiments were carried out in quadruplicate.
- In vitro cross‐linking experiments of purified His6‐TssA1. About 30 μg of purified His6‐TssA1 was cross‐linked (30 min, 1 and 2 h) at room temperature using increasing amounts of ethylene glycol‐bis(succinimidylsuccinate) (EGS; 2 and 5 mM) where indicated. Western blot analysis of cross‐linked products using an anti‐His6 monoclonal antibody is shown. The cross‐linked species are highlighted with stars with the corresponding oligomeric state indicated on the right (1× = monomer; 2× = dimer; 6× = hexamer). Molecular weight markers (kDa) are indicated on the left.
- Analysis of the oligomeric state of TssA1 by AUC. Sedimentation data of His6‐TssA1 (0.56 mg/ml) recorded at a rotor speed of 20,000 rpm is shown. The left panel shows the sedimentation boundary fits and for clarity, only every third scan is shown in the fitted data plots. The experimental absorbance data are shown as black circles, whereas the boundary fits are shown as grey lines. The right panel shows the size‐distribution analysis c(s), obtained from fitting the scan boundaries using SEDFIT, revealing a dodecameric peak (Mr ˜479 kDa) at S20,w value of 16.6 S with a minor peak (Mr ˜1 MDa) at S20,w value of 29.01 S.
