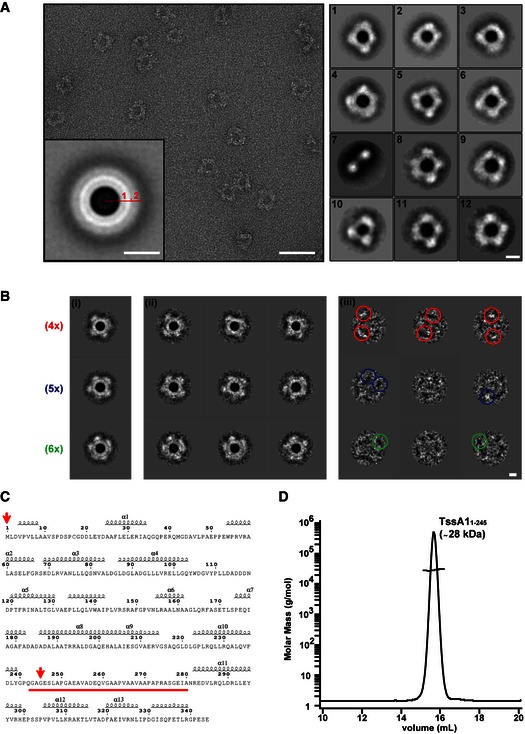
Figure 3. TssA1 forms ring‐shaped structures.

- A representative micrograph of the TssA1 complex (left panel) showing discrete ring‐shaped particles with a diameter of ˜260 Å. The rotationally symmetrized average of the data set (inset panel) presents two distinct rings (numbered), disclosing the layered nature of the TssA1 complex. Representative class averages of the TssA1 complex (right panel) demonstrating the wide range of conformations taken by the ring‐shaped structures. Scale bars are 500 Å in the left panel, 130 Å in the inset and 100 Å in the right panels, respectively.
- Double MSA classification: (i) representative orientation class averages show TssA1 rings arranged into fourfold (4×), fivefold (5×) and sixfold (6×) symmetry‐like complexes (indicated in red, blue and green, respectively); (ii) subclass averages obtained from subclassification of the corresponding orientation class; and (iii) calculated difference images showing some white or black peaks (coloured circles) at the outer ring region. Scale bar is 100 Å.
- Secondary structure prediction based on the amino acid sequence of TssA1 using the web‐based prediction server ESPript 3 (Robert & Gouet, 2014). The linker region from Gly240 to Ala280 is highlighted in red. The positions of the first and last residues of the TssA11–245 truncated protein are indicated by red arrows.
- SEC‐MALS analysis of the purified His6‐TssA11–245. The TssA11–245 elution peak is shown and the corresponding mass is indicated. The molar mass and the differential refractive index (RI) are plotted versus the elution volume. Data were analysed using the ASTRA method (Slotboom et al, 2008).
