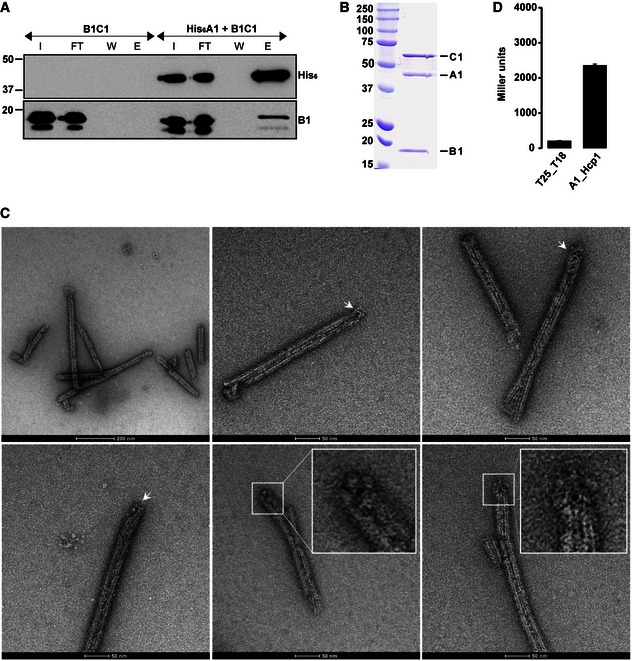
Figure 4. TssA binds at one end of TssBC tubules.

- Co‐purification experiments using His6‐TssA1 and untagged TssB1C1. Western blot analysis of the Ni‐NTA outputs using antibodies directed against the His6‐tag (upper panel) and TssB1 (lower panel). I, input; FT, flow through; W, wash; E, elution.
- SEC elution fraction of the co‐purified His6‐TssA1 and TssB1C1. SDS–PAGE showing the presence of the three proteins His6‐TssA1 (A1), TssB1 (B1) and TssC1 (C1). Molecular weight markers (kDa) are indicated on the left.
- Representative micrographs of the immunogold‐labelled complex His6‐TssA1/TssB1C1. The presence of gold particles is indicated with white arrows. Two close‐up views of TssB1C1 sheath displaying gold particles at one extremity are shown (inset panels). Scale bars are 2,000 and 500 Å for images 1 and 2–6, respectively.
- BTH experiment showing interaction between TssA1 (A1) and Hcp1. A graphical representation of β‐galactosidase activity from E. coli DHM1 cells producing the indicated proteins fused to the adenylate cyclase T25 or T18 subunits is shown. The values shown on the y‐axis correspond to the activity in Miller units. In each case, average activity from two independent experiments is shown and error bars indicate the standard deviation (SD). Experiments were carried out in triplicate.
