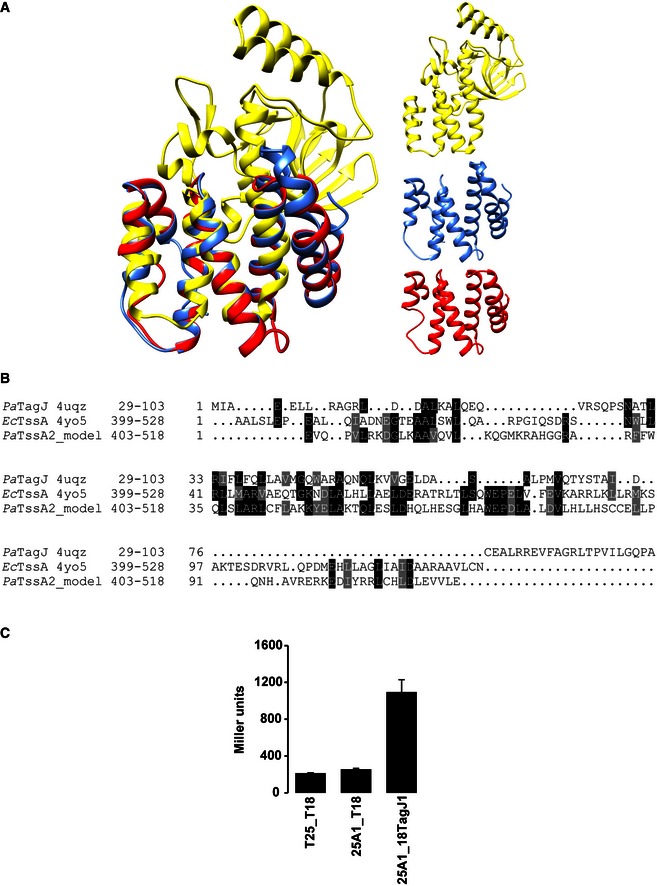
Figure EV4. The TagJ‐like region of EcTssA/TssA2.

- On the left is shown the superposition of the ribbon structures of PaTagJ (PDB code 4UQZ, yellow), the C‐terminal region of EcTssA (PDB code 4YO5, blue) and a 3D structural model of the PaTssA2 C‐terminal region (red). The right panel shows the ribbon structures of PaTagJ (yellow), Cter EcTssA (blue) and PaTssA2 model (red).
- Sequence alignment of N‐terminal TagJ and C‐terminal regions of EcTssA and PaTssA2. The 3D structural model of PaTssA2 has been predicted using Phyre2, who found EcTssA as the highest homologous structure with a 22% sequence identity and 98% confidence score.
- BTH experiment showing interaction between TssA1 (A1) and TagJ. A graphical representation of β‐galactosidase activity from E. coli DHM1 cells producing the indicated proteins fused to the adenylate cyclase T25 or T18 subunits is shown.
