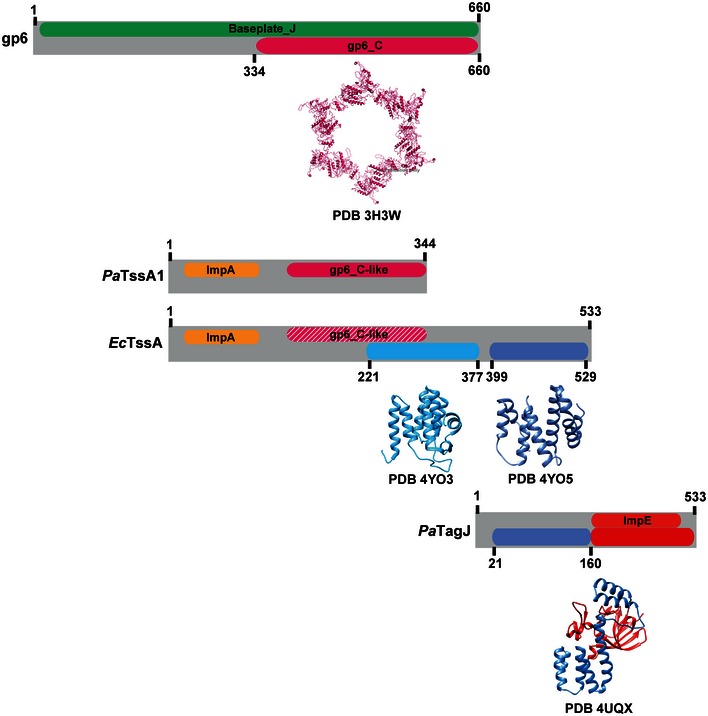
Figure EV5. Comparison between gp6, TssA proteins and TagJ.

Schematic representation of similarities/differences between gp6, PaTssA1, EcTssA and TagJ described in this study. For clarity, the amino acid sequences of these proteins are represented as grey blocks with the corresponding name indicated on the left. Within the grey blocks, coloured boxes indicate the superfamily annotation (top) and regions of known 3D structure (bottom). The ribbon structure and the PDB code are shown below the corresponding colour box. The gp6_C‐like region found in EcTssA is represented as dashed pink box in order to highlight the weaker conservation of this region in this protein. Numbers shown indicate amino acid position.
