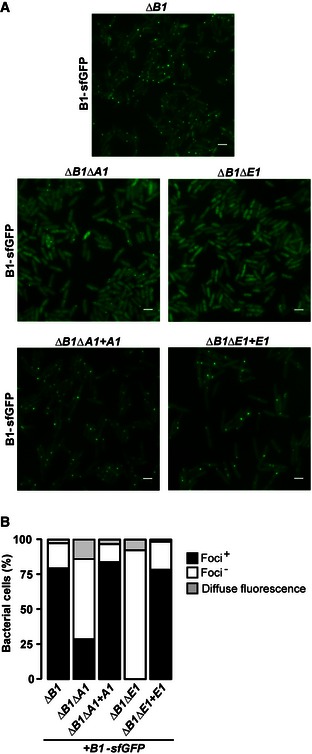
Figure 6. TssA1 impacts TssB1C1 sheath assembly in vivo .

- Fluorescence microscopy images showing the presence/absence of TssBC sheaths (seen as fluorescent foci) in the ∆B1::B1‐sfGFP (top panel), ∆B1∆A1::B1‐sfGFP, ∆B1∆E1::B1‐sfGFP cells (middle panels) and in the complemented strains ∆B1∆A1::B1‐sfGFP + A1 and ∆B1∆E1::B1‐sfGFP + E1 (bottom panels). Scale bars are 2 μm.
- Quantification of TssB1‐sfGFP foci and of diffuse fluorescence in various P. aeruginosa backgrounds imaged in (A). Values are normalized to the total number of bacteria (%). Data were obtained from three independent experiments, with images and values from representative replicates being shown.
