
Figure 3. Pgc1 localizes to the ER before stably concentrating on LDs.
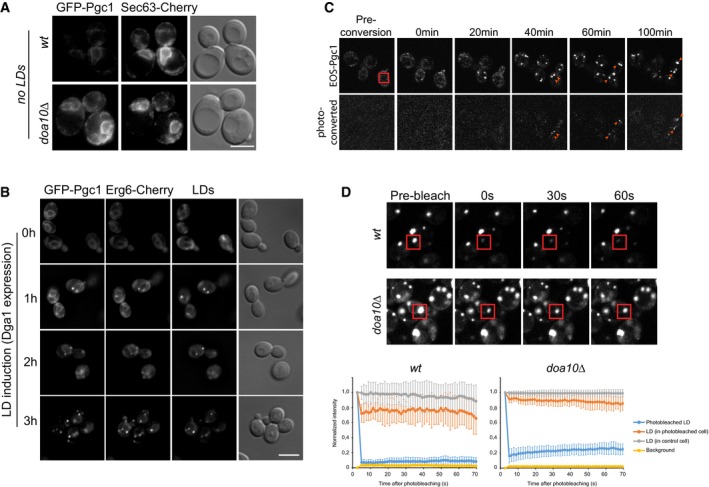
- Localization of GFP‐Pgc1 in are1Δ are2Δ lro1Δ dga1Δ cells in the presence (no LDs) or absence of DOA10 (no LDs doa10Δ). The ER was visualized by expression of Sec63‐Cherry. Scale bar: 5 μm.
- GFP‐Pgc1 was expressed under the ADH1 promoter; LD formation was stimulated by galactose‐induced expression of DGA1 in are1Δ are2Δ lro1Δ. Fluorescence microscopy was used to follow GFP‐Pgc1 localization over time. LDs were visualized upon staining with the neutral lipid dye MDH. Scale bar: 5 μm.
- Photoconversion of tdEOS‐Pgc1 expressed under the ADH1 promoter; LD formation was stimulated by galactose‐induced expression of DGA1 in are1Δ are2Δ lro1Δ doa10Δ cells. The red square marks the photoconverted region. The time (in minutes) after photoconversion is indicated. Arrowheads point to LDs containing photoconverted tdEOS‐Pgc1. Scale bar: 5 μm.
- FRAP experiment of GFP‐Pgc1 in wt and doa10Δ cells. Representative examples are shown. The bleached areas are marked by red squares and include a LD adjacent to ER. The time (in seconds) after photobleaching is indicated. Each graph shows average fluorescence intensities for 10 cells normalized to pre‐bleached plotted over time. Error bars indicate standard deviation.