
Figure 4. Pgc1 is degraded by Doa10 at the ER .
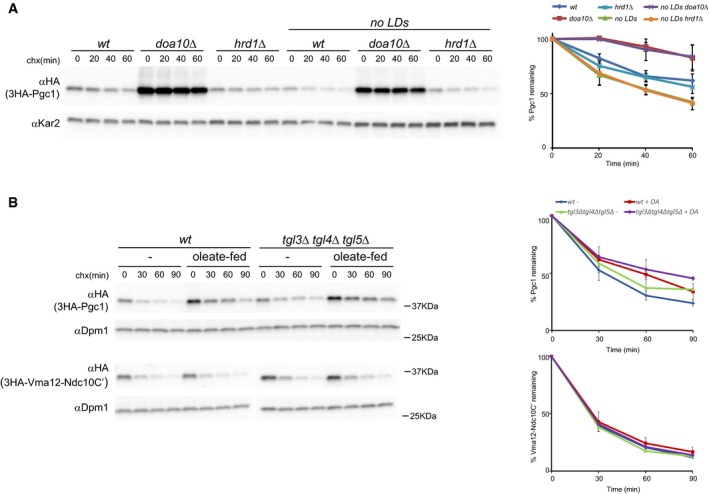
- The degradation of 3HA‐Pgc1 was analyzed in cells with the indicated genotype as in Fig 1A. The graph shows the average of three independent experiments; error bars represent the standard deviation.
- The degradation of the Doa10 substrates 3HA‐Pgc1 and 3HA‐Vma12‐Ndc10C' was analyzed in cells of the indicated genotypes treated with oleic acid. 3HA‐Pgc1 and 3HA‐Vma12‐Ndc10C' were detected with anti‐HA antibodies. Dpm1 was used as a loading control and detected with anti‐Dpm1 antibodies. The graph shows the average of three independent experiments; error bars represent the standard deviation.
Source data are available online for this figure.