
Figure 2.
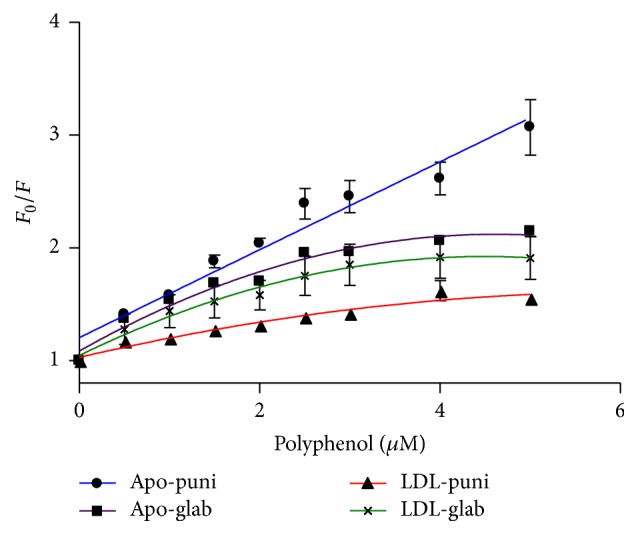
Stern-Volmer plots of the fluorescence quenching of ApoB100 and LDL by glabridin (glab) and punicalagin (puni). Each experiment was repeated separately at least three times. Results are presented as mean ± SD. R 2 = 0.9 and p < 0.0001 for the linear plot (ApoB100-punicalagin interaction).