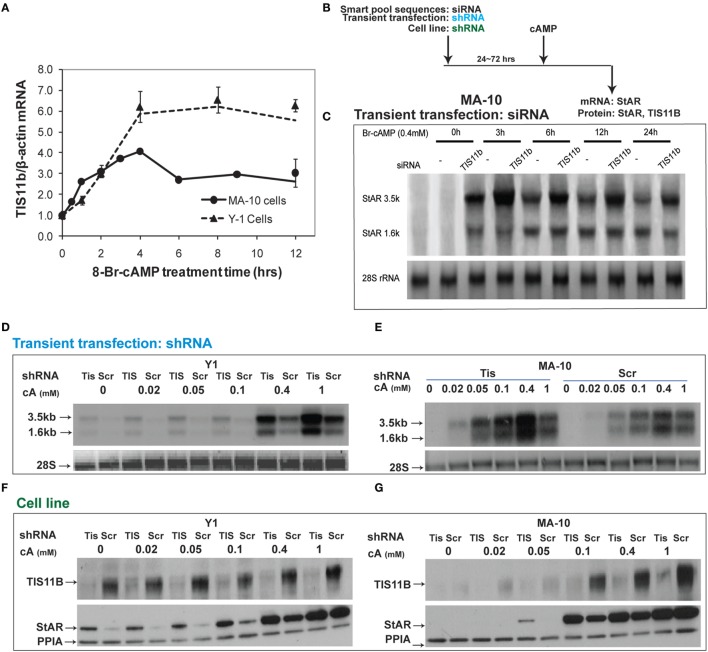
Figure 8.
Suppressive effects of Tis11b in both Y-1 and MA-10 cells. (A) Induction of TIS11b in Y-1 and MA-10 cells by 1 mM Br-cAMP, measured by q-PCR (34). (B) Schematic for the suppression of TIS11b using siRNA and shRNA in the indicated cell lines. (C) Time course for the selective stimulation of 3.5-kb StAR mRNA following the suppression of Tis11b (34). (D,E) Effects of Tis11b (shRNA) suppression on the dose–response stimulation of StAR mRNA levels. (F,G) Effects of Tis11b (cell line) suppression on the dose–response stimulation of Tis11b mRNA and StAR protein levels.

