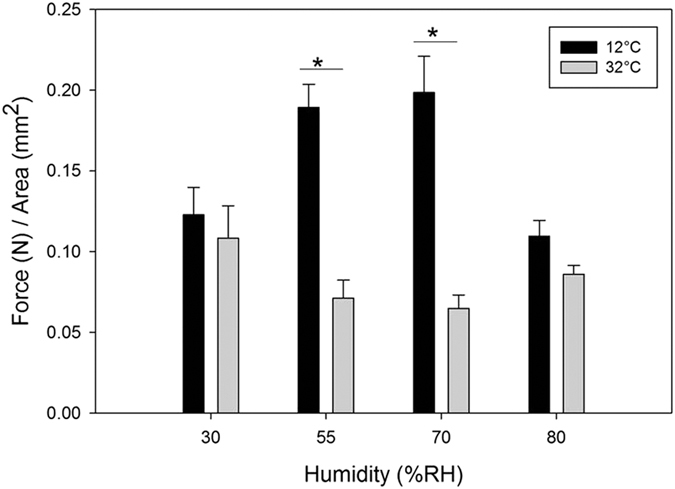
Figure 1. Average force per unit area of synthetic gecko tape.

Samples were tested in two temperatures (12 °C black bars; 32 °C grey bars) at four different humidity settings. Bars with an asterisk above signify a statistically significance difference between the two groups (p < 0.05). Error is reported as mean ± 1 s.e.m.
