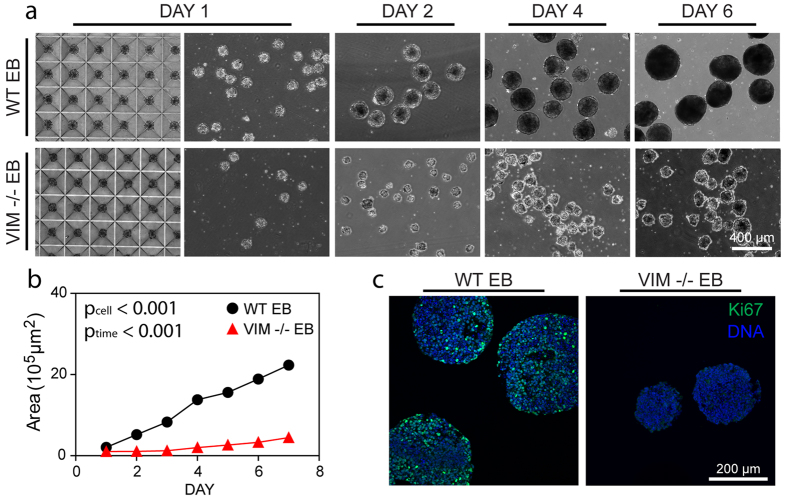
Figure 2. Growth of VIM −/− EBs is slower than that of WT EBs.
(a) Phase images for WT EBs and VIM −/− EBs at Day 1 before (left image) and after removal (right image) from the microwells, as well as at Day 2, 4, 6 in suspension culture. All images are at the same magnification and the scale bar represents 400 μm. (b) Cross sectional areas for WT EBs and VIM −/− EBs were calculated from phase images (n = 50 EBs per group). (c) Immunohistochemical analysis indicates the proliferation marker Ki67 (green) with a nuclear counterstain (blue). Scale bar represents 200 μm.

