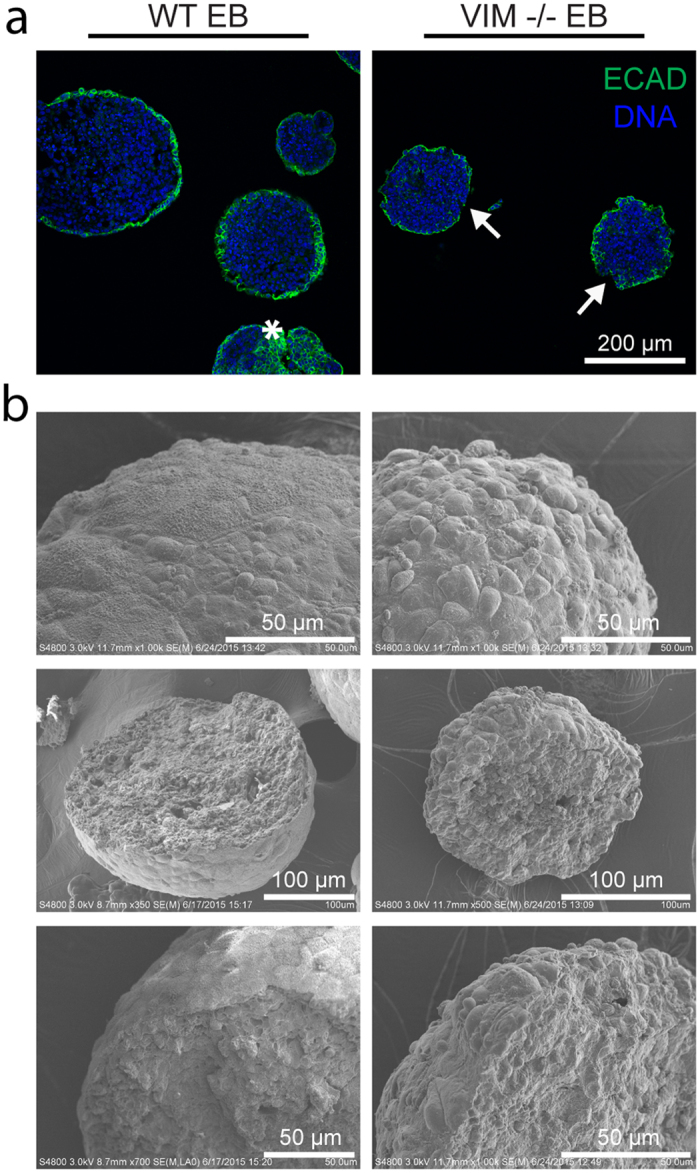
Figure 3. EB surface properties are distinct in VIM −/− EBs compared to WT EBs.

(a) Histological sections were stained for ECAD protein (green) with a nuclear counterstain (blue). The star indicates staining within the interior of a WT EB and arrows indicate discontinuous ECAD expression along VIM −/− EB outer layers. All images are at the same magnification and the scale bar represents 200 μm. (b) SEM images were taken of both whole and fractured WT EBs and VIM −/− EBs. Length of scale bars is indicated in each image.
