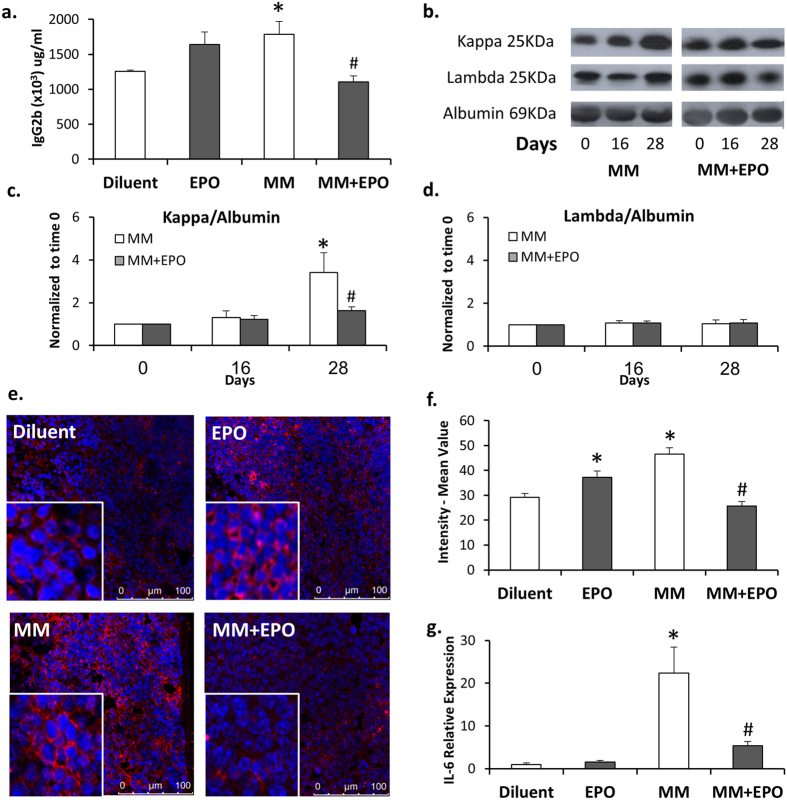
Figure 1. EPO treatment attenuates disease progression.
Sera from healthy or MM mice treated with EPO or diluent were subjected to (a) ELISA analysis for IgG2b on day 28 (b) Representative Western blot probed with anti-kappa, anti-lambda or anti-albumin antibodies. (c–d) Graphs represent a summary of all mice analyzed N>7. Data, Mean ± SEM, were analyzed by Student’s t-test *MM day 28 versus MM day 0; #MM + EPO versus MM on day 28, p < 0.05. (e) Splenic sections were stained using a fluorescent antibody directed to the CD138 (red staining) surface marker, nuclei were stained with DAPI (blue). Representative images are shown. (f) Graphs represent a quantitation of at least 3 fields of sections from N = 3 mice in each group. (g) RT-PCR quantification of IL-6 mRNA expression in BM from healthy or MM mice treated with EPO or diluent. Transcript levels in diluent-injected mice were considered as 1, N > 7. Data in a, f and g, Mean ± SEM, were analyzed by 1-way ANOVA with Bonferroni post-hoc test *MM versus Diluent; #MM + EPO versus MM, p < 0.05.

