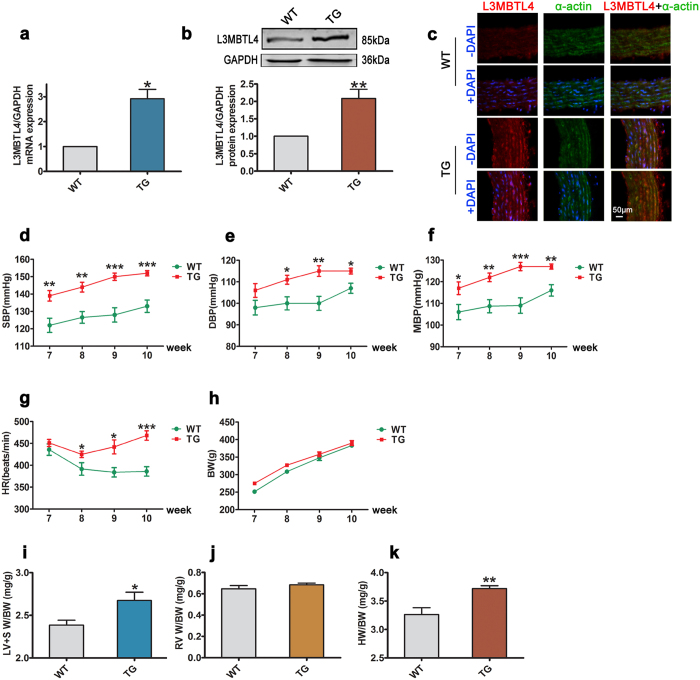
Figure 2. Blood pressure and cardiac parameters of L3MBTL4 transgenic rats.
(a) Relative mRNA expression of L3MBTL4 in the blood vessels from wild type rats (WTs) and transgenic rats (TGs) (n = 7 each group). (b) L3MBTL4 protein levels in the vasculature are measured by western blot analysis (n = 7 per group). (c) Representative immunofluorescence images of L3MBTL4 (red) and α-actin (green) in the vessels from WTs and TGs. Nuclei are stained with DAPI (blue). Scale bars are 50 μm. n = 3 independent experiments. (d–h) Systolic blood pressure (SBP), diastolic blood pressure (DBP), mean blood pressure (MBP), heart rate (HR) and body weight (BW) of WTs and TGs (n = 8 each group). (j,k) Quantitative analysis of left ventricle + septum weight/body weight (LV + SW/BW), right ventricle weight/body weight (RVW/BW) and heart weight/body weight (HW/BW) ratios between groups (n = 6 each group). *p < 0.05, **p < 0.01, ***p < 0.001 compared to WT. All data represent mean ± s.e.m.

