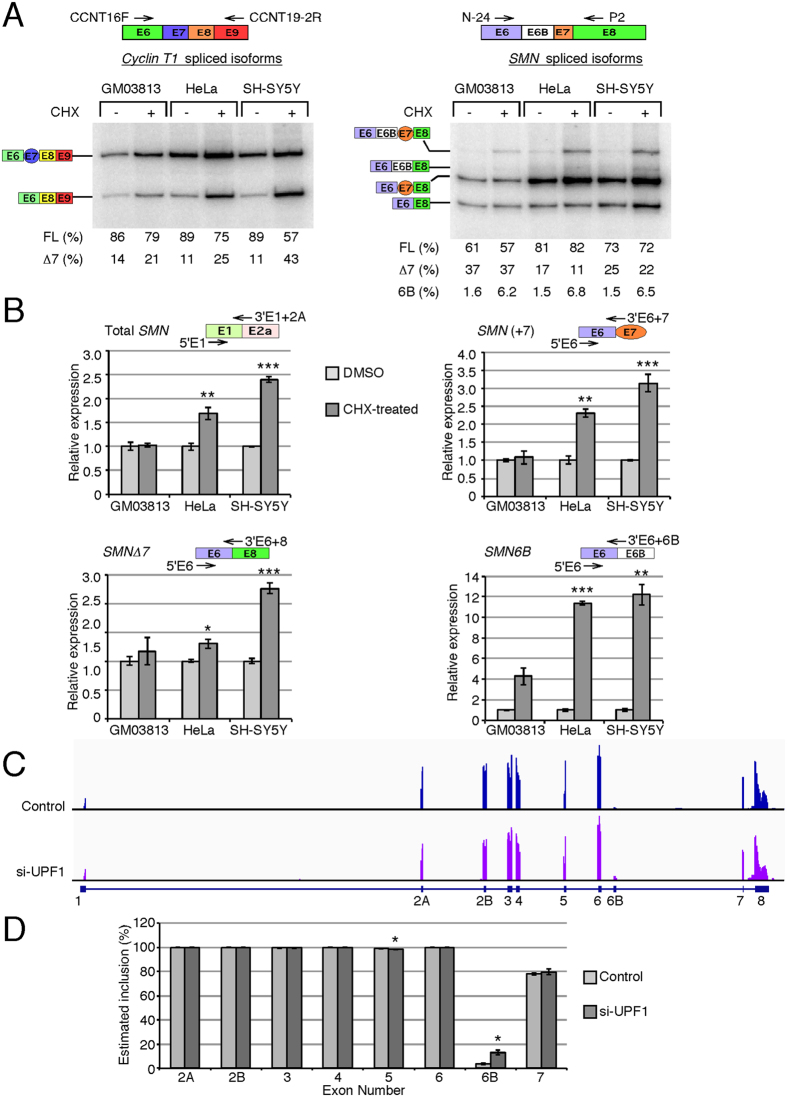
Figure 4. Susceptibility of exon 6B-containing transcripts to NMD.
(A) RT-PCR results for Cyclin T1 and SMN transcripts are shown in the left and the right panels, respectively. Cells were treated with DMSO (−) or 20 μg/ml CHX (+) for 6 h. Other descriptions are the same as in Fig. 2A. FL: full-length. (B) Quantification of various SMN transcripts by QPCR under CHX treatment. The identity of each isoform and annealing position of primers used to amplify them are indicated above each graph. Values are expressed as relative to untreated samples. Error bars represent the standard error of 3 biological replicates. (C) Genomic view of RNA-Seq of HeLa cells with and without UPF1 depletion (SRA accession number SRP063462). Exon positions are shown at the bottom. (D) Estimated exon inclusion for all internal exons of SMN based on sequencing data from (C). Error bars represent standard error of 2 sequencing libraries. Statistical significance: *p < 0.05, **p < 0.01, ***p < 0.001.

