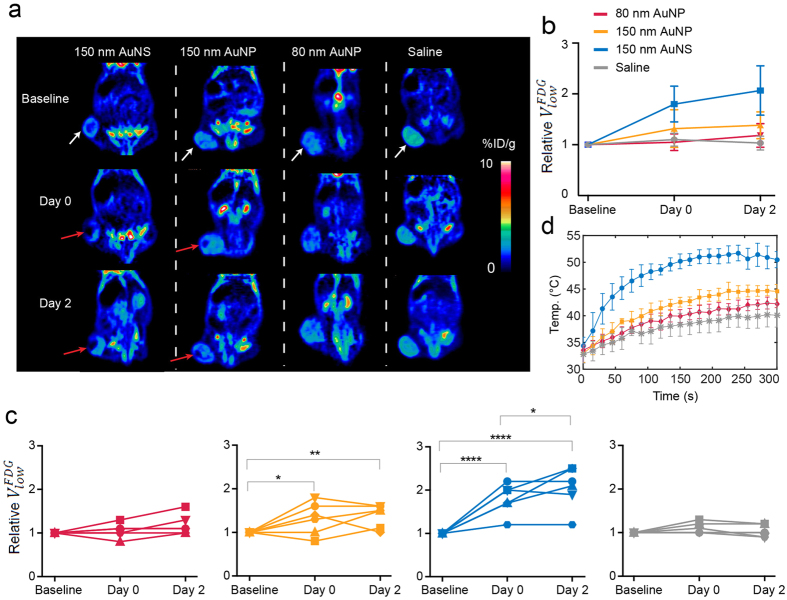
Figure 4. PET evaluation of the treatment response.
(a) Images showing the coronal planes of the 18F-FDG PET scan of mice from each nanoparticle group (columns). The rows show the baseline PET scan, the scan immediately after the laser irradiation (Day 0), and the scan two days post-treatment (Day 2). White arrows mark the tumor location where the nanoparticles were administered and subsequently irradiated with the 807 nm laser (laser intensity of 0.58 W/cm2). In the mice from the AuNS and 150 nm AuNP groups there is a tumor subvolume with decreased uptake of 18F-FDG (marked by red arrows) both at Day 0 and Day 2. (b,c)  at different timepoints. If the treatment is effective this volume will increase after laser irradiation. Each individual data set has been normalized to the baseline value. The mean relative changes in the tumor volume with low 18F-FDG uptake in the four treatment groups are shown in (b) and for individual animals in (c) (red: 80 nm AuNP, yellow: 150 nm AuNP, blue: 150 nm AuNS, and grey: saline). n = 6, each group. (d) Plots of the temperature evolution measured using thermographic imaging at the skin surface of the tumors of mice receiving AuNSs (blue circle, n = 3), 80 nm AuNP (red diamonds, n = 3), 150 nm AuNP (yellow squares, n = 3), and saline (grey stars, n = 7). The laser intensity was 0.58 W/cm2. Error bars represent one SD. * denotes p value < 0.05, ** denotes p value < 0.01, and **** denotes p value < 0.0001.

