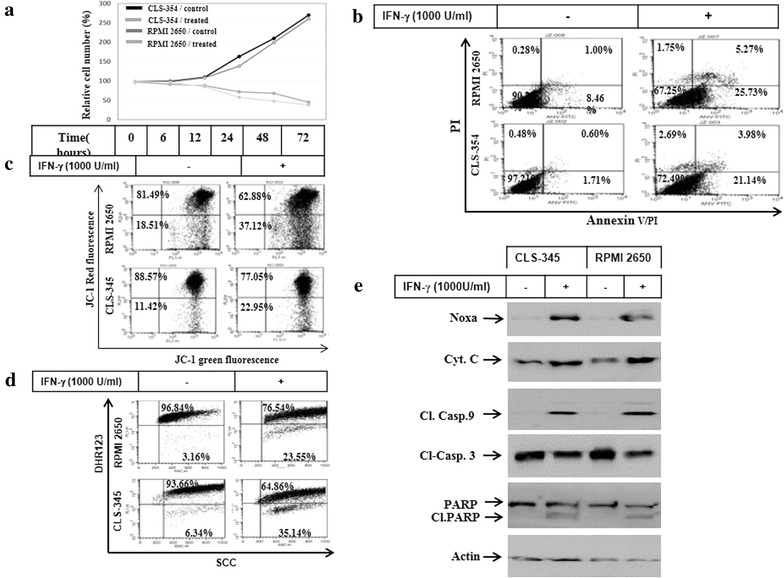
Fig. 1.

a Time course experiment demonstrates cell growth inhibition of HNSCC cell lines CLS-354 and RPMI 2650. Relative cell number (%) assessed by MTT assay following the exposure of cells to IFNγ (1000 U/ml) for regulated time intervals up to 72 h. The values are expressed as the mean ± SD of three independent experiments performed in duplicate. The Student’s t test was used for analysis. b Flow cytometry analysis of the induced apoptosis of CLS-354 and RPMI 2650 cells using annexin V/PI staining following the exposure to IFNγ for 48 h. c Flow cytometry analysis of the mitochondrial membrane potential (Δψm) in CLS-354 and RPMI 2650 cells using JC-1 staining following the exposure to IFNγ for 48 h. d Assessment of ROS level in CLS-354 and RPMI 2650 cells following the exposure to IFNγ for 48 h. ROS generation was measured by flow cytometry using dihydrorhodamine (DHR 123). e Western blot analysis of the pro-apoptotic protein Noxa, cytochrome c, cleavage of caspase-9, caspase-3 and PARP following the exposure of CLS-354 and RPMI 2650 cells to IFNγ for 48 h. Actin was used as internal control for loading and transfer. Data are representative of three dependent experiments performed separately
