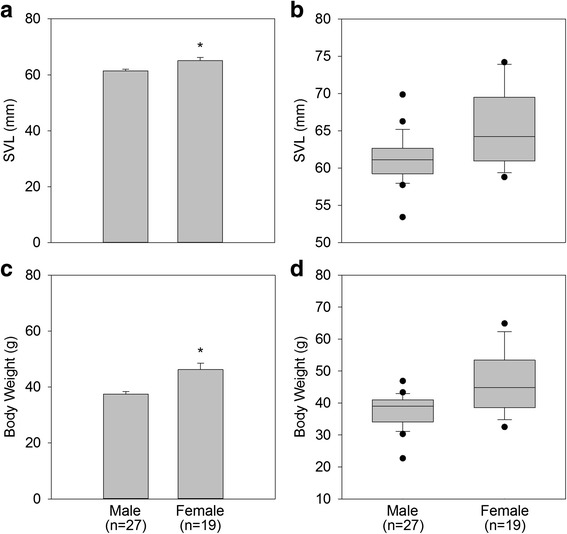
Fig. 1.

Comparisons of snout-vent-length (SVL; mm) and body weight (g) measurements for male and female DGFs. Mean SVL (Panel a) and body weight (Panel c) were significantly different (*, p < 0.05) between males and females, with females demonstrating greater mean SVL and body weight. Boxplots for SVL (Panel b) and body weight (Panel d) demonstrate there was a large overlap between males and females for both measures. In panels b and d, boxes show the quartile 1 to quartile 3 ranges with the horizontal line indicating the median. Whiskers show the 90th and 10th percentile, and the dark circles indicate outliers beyond this range
