
Fig. 5.
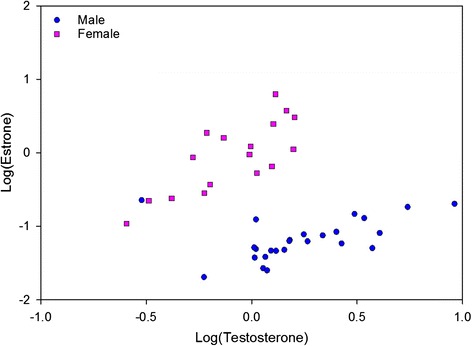
Scatterplot showing the sex of the DGFs can be distinguished by the ratio of urinary testosterone to estrone. Data shown are log transformed. Blue circles indicate males, while females are indicated by pink squares
Official websites use .gov
A
.gov website belongs to an official
government organization in the United States.
Secure .gov websites use HTTPS
A lock (
) or https:// means you've safely
connected to the .gov website. Share sensitive
information only on official, secure websites.
Scatterplot showing the sex of the DGFs can be distinguished by the ratio of urinary testosterone to estrone. Data shown are log transformed. Blue circles indicate males, while females are indicated by pink squares