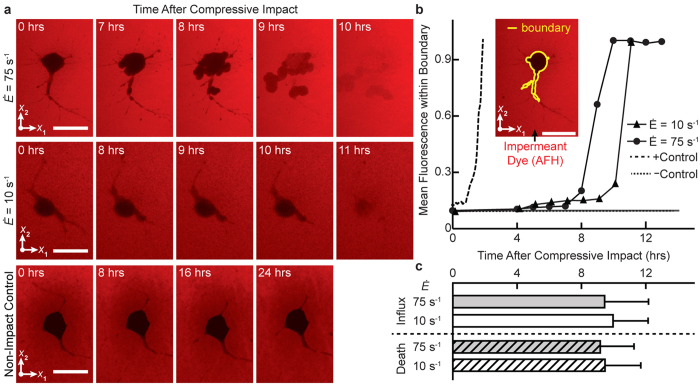
Figure 5. Cell permeability after compressive impact.
(a) Minimum intensity projections of a representative neuron showing the spatiotemporal intensity distribution of cell-impermeant Alexa Fluor 568 hydrazide (AFH) after compression at strain rates  of 10 s−1 (top) and 75 s−1 (bottom). Scale bar, 20 µm. (b) Mean fluorescence intensity within the cell boundary (inset) for
  (solid triangle),
  (solid circle), a positive control (long dash) with Triton X-100, and a negative control (short dash) without compressive loading. Scale bar, 20 µm. (c) AFH influx time (mean ± standard deviation), or peak rise in internal fluorescence, for
  (solid white; n = 16 cells, N = 5 experiments) and
  (solid gray; n = 23, N = 8), and cellular death time for
  (hatched white; n = 19, N = 8) and
  (hatched gray; n = 22, N = 8). No significant difference was found via t-test comparison.

