
Figure 3.
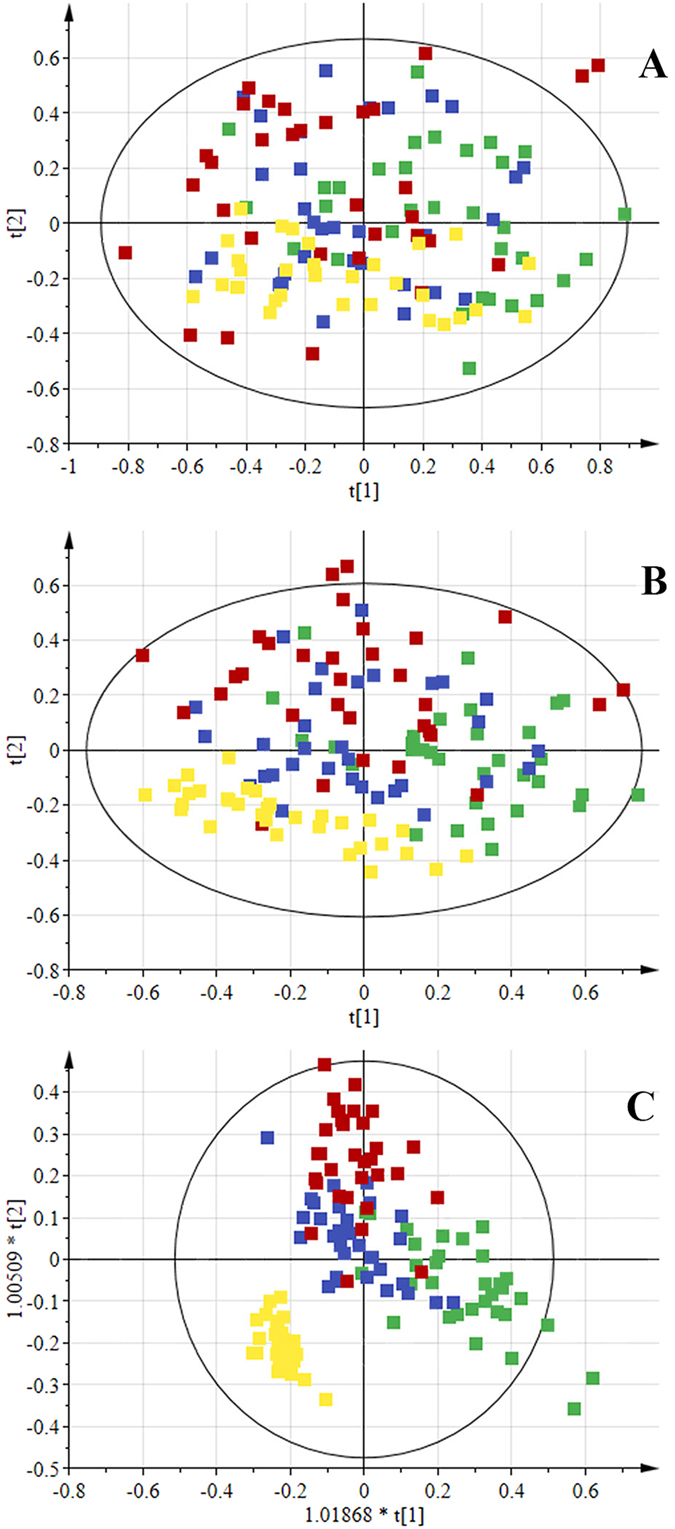
Scores scatter plots (A) PCA, (B) PLS-DA and (C) OPLS-DA of 1H CPMG NMR spectra of serum from ALL (green), AML (blue), APA (red) and healthy control (yellow).
Official websites use .gov
A
.gov website belongs to an official
government organization in the United States.
Secure .gov websites use HTTPS
A lock (
) or https:// means you've safely
connected to the .gov website. Share sensitive
information only on official, secure websites.
Scores scatter plots (A) PCA, (B) PLS-DA and (C) OPLS-DA of 1H CPMG NMR spectra of serum from ALL (green), AML (blue), APA (red) and healthy control (yellow).