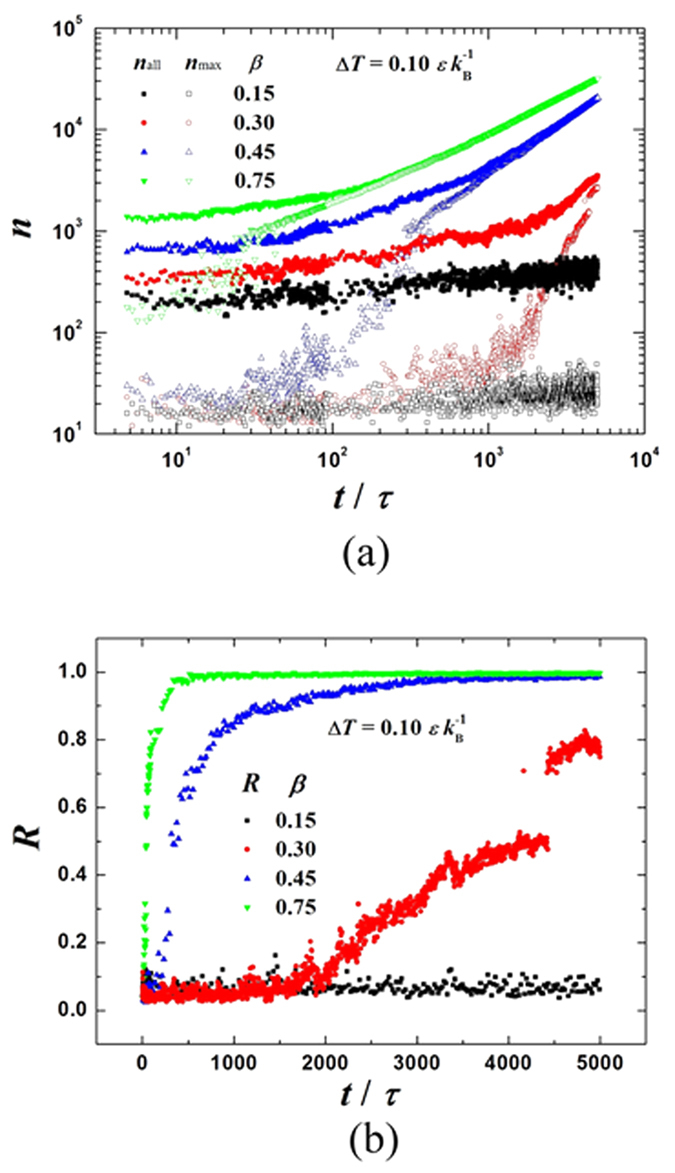
Figure 4. Time evolutions.

(a) Evolutions of the number of molecules in the maximum size surface cluster (nmax) and the number of molecules in all surface clusters (nall); (b) The ratio (R) of nmax over nall. The surfaces are at the same temperature  but with different fluid-solid bonding parameters: β = 0.15, 0.30, 0.45 and 0.75 (
 ,
,  ).
).
