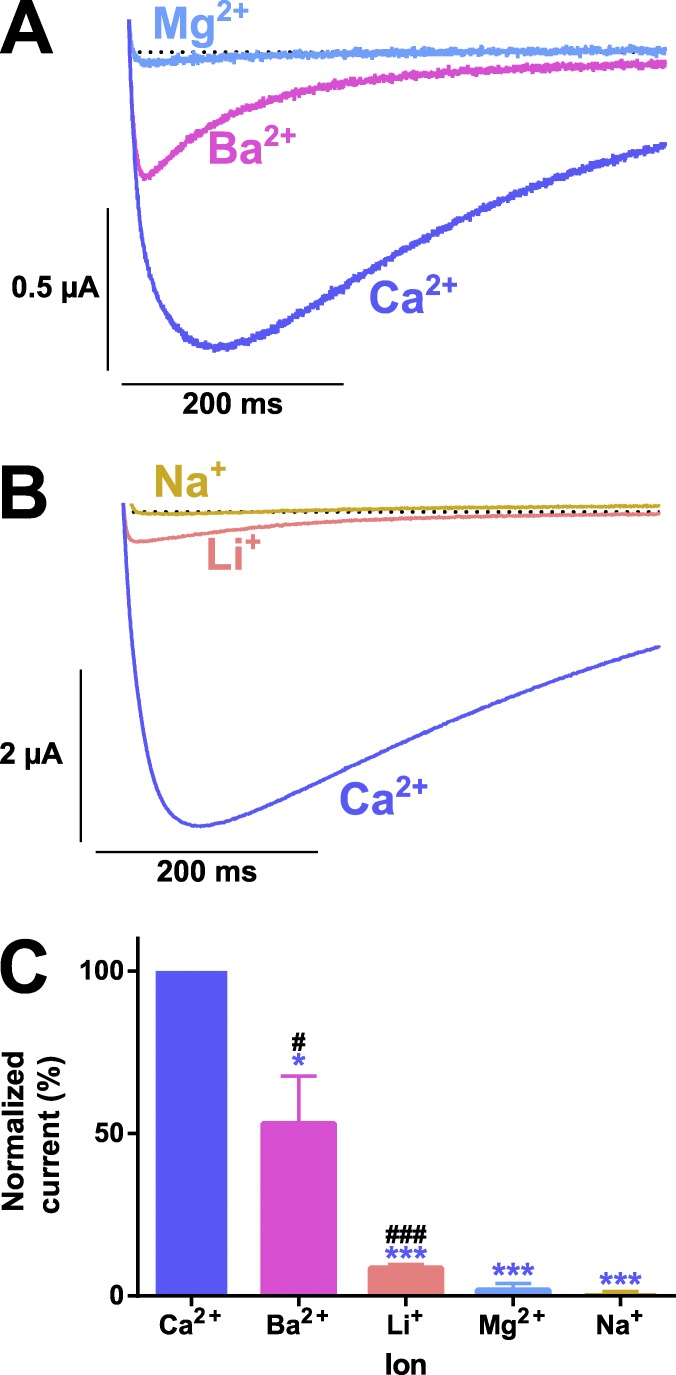
Figure 5.
Ionic selectivity of the wild-type AmCaV4 channel. (A) Representative current traces recorded in response to a −10-mV test pulse in extracellular solutions containing divalent ions. (B) Representative current traces recorded in response to a −10 mV test pulse in the extracellular solutions containing monovalent ions. (C) The relative permeability of the ions was calculated by dividing the peak current in a given solution by the peak current in the Ca2+ solution (n = 3). The asterisks designate values that were deemed statistically different from the relative permeation of Ca2+ determined using a one-way ANOVA (*, P < 0.05; ***, P < 0.001). The number signs designate means that were deemed statistically different from 0 (no measurable current) determined using a t test (#, P < 0.05; ###, P < 0.001). All oocytes included in these series of experiments were injected with 50 nl EGTA chelating solution prior recordings. Error bars represent SEM.

