Figure 3.
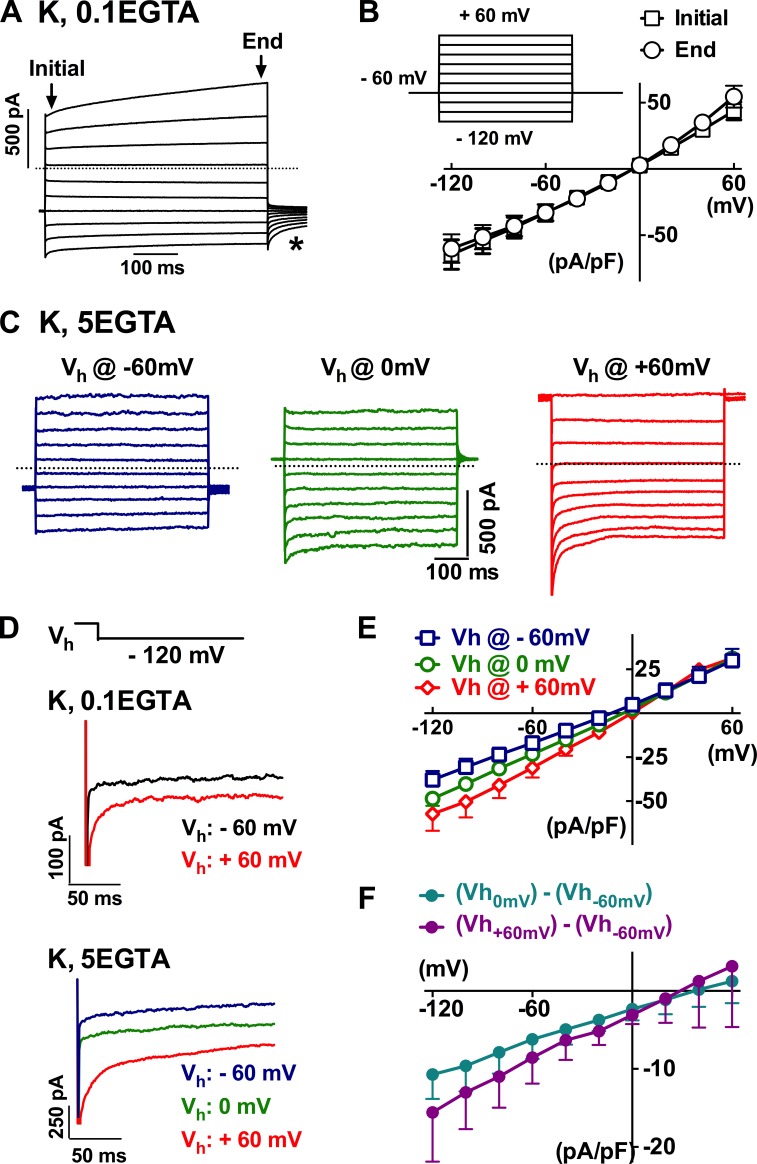
Whole-cell currents in single epididymal epithelial cells. (A) Typical whole-cell currents recorded from single epididymal epithelial cells when bathed in normal PSS and dialyzed with 0.1 mM EGTA potassium-based pipette solution (K, 0.1 EGTA) using a pulse-eliciting protocol as in the inset in B. The asterisk indicates the tail current. The dotted line (herein and in the subsequent figures) indicates the zero current level. (B) The current–voltage relationship of the currents from the epithelial cells as in A. (C–E) The current response recorded with a dialyzing pipette solution of strong intracellular Ca2+ buffering with 5 mM EGTA at holding potentials of −60, 0, and 60 mV. (F) Digitally subtracting the currents recorded at holding potential of −60 mV from that at 0 or 60 mV gave inwardly rectifying currents with a reversal potential proximately close to 30 mV. Error bars represent SEM.

