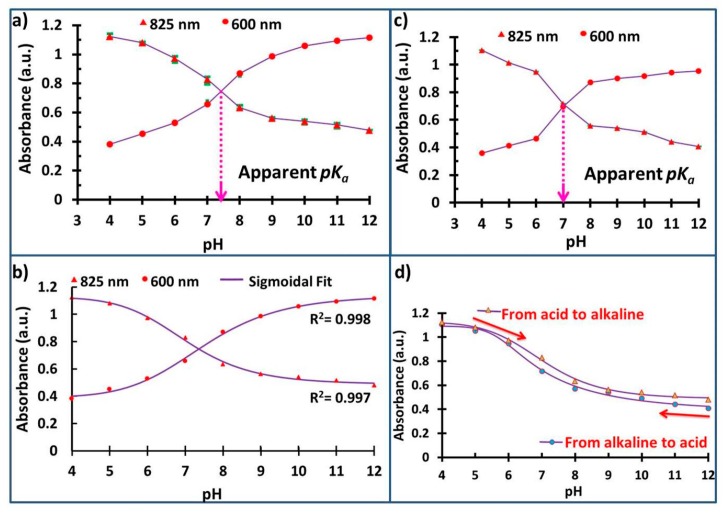
Figure 5.
Graphs of the absorbance change vs. pH for PANI-PSU-20 membranes during forward titrations, pH 4 → pH 12, (a); and backward titrations, pH 12 → pH 4, (c); Dual wavelength calibration curves for the pH dependence of the absorption at 600 and 825 nm (b); and the pH titration curves demonstrating hysteresis at 825 nm (d).

