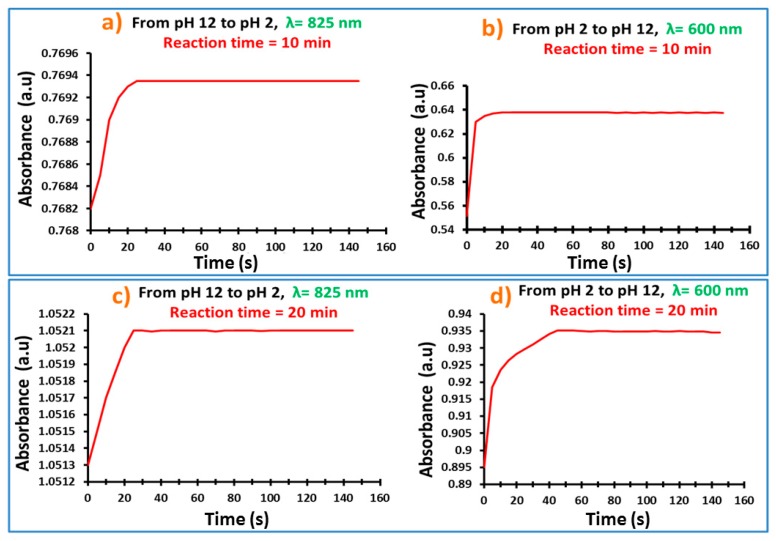
Figure 6.
Response time for PANI-PSU-10 membranes (a,b) and PANI-PSU-20 membranes (c,d). Each membrane was placed in a buffer solution of pH 12 and then in buffer solution of pH 2 for the measurement of response time at 825 nm; after that, the same membrane was placed back in a buffer solution of pH 12 for the measurement of response time at 600 nm.

