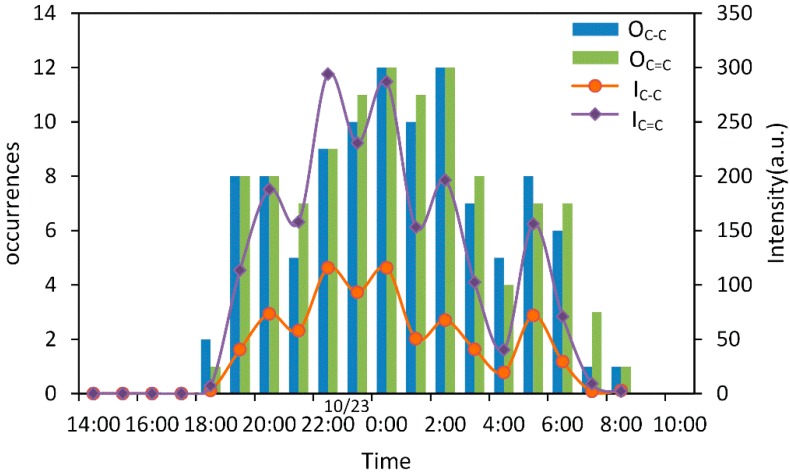
Figure 5.
Hourly changes of occurrences and average intensity of carotenoid Raman signals resulted from C–C stretching and C=C stretching. (OC–C, the occurrences of C–C stretching mode; OC=C, the occurrences of C=C stretching mode; IC–C, the average intensity of C–C stretching mode of an hour; IC=C, the average intensity of C=C stretching mode of an hour). Blue and green histogram signify the occurrences detection of C–C stretching at 1157 cm−1 and C=C stretching mode of β-carotene at 1527 cm−1 (detection 12 times per hour), respectively. Orange lines and violet points represent average intensity of one hour of all above carotenoids.

